Comparative Study
. 2005 Apr;206(4):373-85.
doi: 10.1111/j.1469-7580.2005.00397.x.

Relationship of brain and skull in pre- and postoperative sagittal synostosis

Affiliations
Free PMC article
Comparative Study

Relationship of brain and skull in pre- and postoperative sagittal synostosis

Kristina Aldridge et al. J Anat. 2005 Apr.
Free PMC article

Erratum in

  • J Anat. 2006 Feb;208(2):259

Abstract

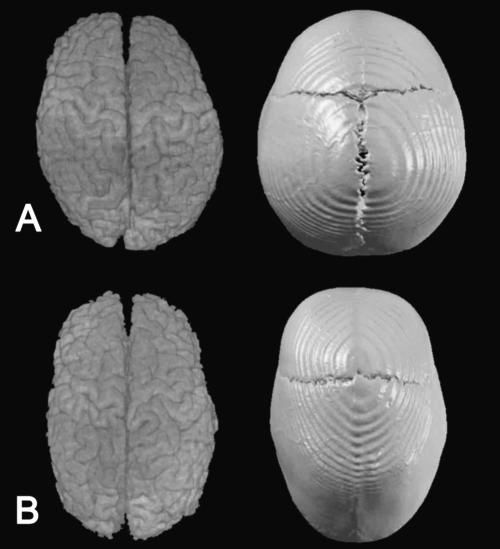
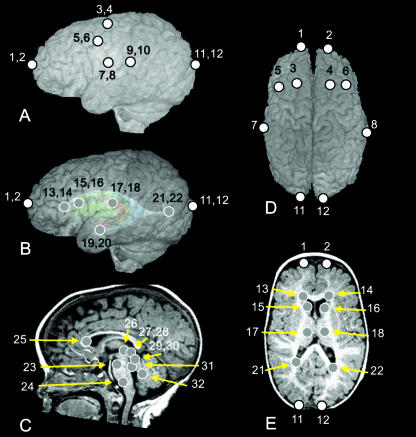
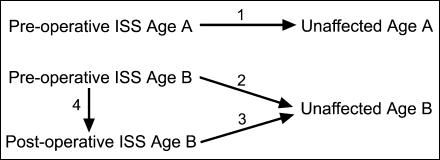
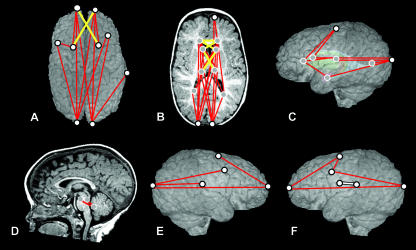
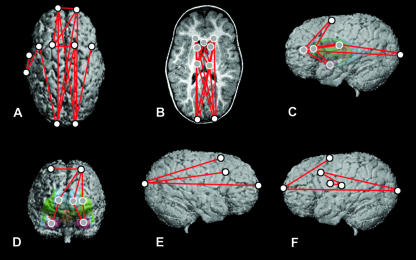
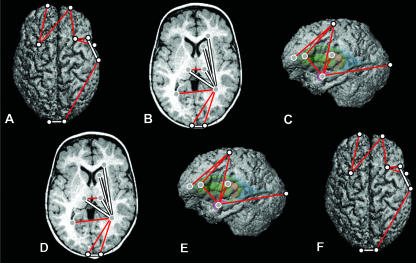
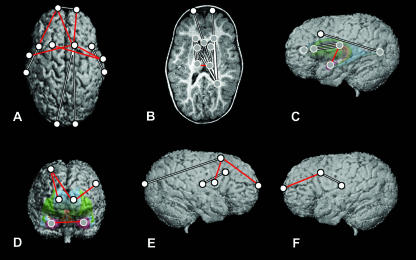
Models of vertebrate skull evolution stress the coordinated developmental relationship between the skull and the brain that it houses. This study investigates the relationship between altered skull morphology and brain morphology in premature fusion of the cranial sagittal suture (isolated sagittal synostosis; ISS), a condition associated with dysmorphology of both neurocranium and brain. Although the skull displays a more normal shape following reconstructive cranial vault surgery, effects of this surgery on the brain have not been investigated. Landmark coordinate data were collected from three-dimensional magnetic resonance imaging reconstructions of the brain in a sample of ISS patients and an age-matched unaffected cohort. These data were analysed using Euclidean distance matrix analysis (EDMA). Results show that the brain in ISS is dysmorphic preoperatively, displaying a posteriorly directed neural expansion that does not 'worsen' with growth. Postoperatively, the brain in ISS displays a more globular shape overall as compared with the preoperative morphology, but differs from normal in its subcortical morphology. These results show that the ISS brain is altered following neurocranial surgery, but does not more closely approximate that of unaffected individuals. This suggests that although the brain is affected by manipulation of the skull, it retains a growth pattern that is, at least in part, independent of the skull.


Figures

Fig. 1
Fig. 1
Superior view of CT and MRI reconstructions of the skull and the brain of a child unaffected by craniosynostosis (A) and a child affected by isolated sagittal synostosis (B).
Fig. 2
Fig. 2
Landmarks collected for analysis, illustrated on an MRI of a patient with ISS. (A) Left lateral view of the 3D surface illustrating cortical surface landmarks. (B) Left lateral view of the 3D surface with a model of subcortical structures ghosted beneath illustrating subcortical landmarks with respect to surface topography. (C) Midsagittal slice illustrating near midline subcortical landmarks. (D) Superior view of the 3D surface illustrating cortical surface landmarks. (E) Transverse slice illustrating subcortical landmarks. White dots represent landmarks located on the cortical surface, whereas grey dots represent landmarks located on subcortical structures. Numbers refer to landmark definitions given in Table 2.
Fig. 3
Fig. 3
Illustration of the four sets of comparisons performed in this study.
Fig. 4
Fig. 4
Comparisons of preoperative ISS vs. unaffected at Age A, shown on MRI reconstructions of a preoperative ISS patient. The top row represents a superior view of the cortical surface (A), a transverse slice displaying subcortical structures (B) and the left lateral view of the 3D surface with a model of subcortical structures ghosted beneath (C). The bottom row represents a midsagittal slice (D), a right lateral view of the 3D reconstruction of the cortical surface (E) and a left lateral view of the 3D reconstruction of the cortical surface (F). White dots represent landmarks located on the cortical surface, and grey dots represent landmarks located on subcortical structures. Red and yellow lines indicate linear distances that are significantly greater in the ISS sample, and the white line (F) indicates the single linear distance that is significantly smaller in the ISS sample.
Fig. 5
Fig. 5
Comparisons of preoperative ISS vs. unaffected at Age B, shown on MRI reconstructions of a preoperative ISS patient. The top row represents a superior view of the cortical surface (A), a transverse slice displaying subcortical structures (B) and the left lateral view of the 3D surface with a model of subcortical structures ghosted beneath (C). The bottom row represents a midsagittal slice (D), a right lateral view of the 3D reconstruction of the cortical surface (E) and a left lateral view of the 3D reconstruction of the cortical surface (F). White dots represent landmarks located on the cortical surface, and grey dots represent landmarks located on subcortical structures. Red lines indicate linear distances that are significantly greater in the ISS sample; there are no linear distances that are significantly smaller in the ISS sample.
Fig. 6
Fig. 6
Comparisons of postoperative an ISS sample and unaffected sample at Age B, shown on MRI reconstructions of a postoperative ISS patient. The top row represents a superior view of the cortical surface (A), a transverse slice displaying subcortical structures (B) and the left lateral view of the 3D surface with a model of subcortical structures ghosted beneath (C). The bottom row represents a midsagittal slice (D), a right lateral view of the 3D reconstruction of the cortical surface (E) and a left lateral view of the 3D reconstruction of the cortical surface (F). White dots represent landmarks located on the cortical surface, and grey dots represent landmarks located on subcortical structures. Red lines indicate linear distances that are significantly greater in the postoperative ISS sample, and white lines indicate linear distances that are significantly smaller.
Fig. 7
Fig. 7
Comparisons of postoperative ISS and preoperative ISS samples at Age B, shown on a preoperative ISS patient. The top row represents a superior view of the cortical surface (A), a transverse slice displaying subcortical structures (B) and the left lateral view of the 3D surface with a model of subcortical structures ghosted beneath (C). The bottom row represents a midsagittal slice (D), a right lateral view of the 3D reconstruction of the cortical surface (E) and a left lateral view of the 3D reconstruction of the cortical surface (F). White dots represent landmarks located on the cortical surface, and grey dots represent landmarks located on subcortical structures. Red lines indicate linear distances that are significantly greater in the postoperative sample; white lines indicate those that are significantly smaller in the postoperative sample.

Similar articles

Cited by

References

    1. Aldridge K, Barta P, Pearlson G, Richtsmeier J. Brain morphology, MRI data, and landmark-based analyses of form. Am. J. Phys. Anthropol. Suppl. 2000;30:94.
    1. Aldridge K, Marsh JL, Govier D, Richtsmeier JT. Central nervous system phenotypes in craniosynostosis. J. Anat. 2002;201:31–39. - PMC - PubMed
    1. Aylward E, Augustine A, Li Q, Barta P, Pearlson G. Measurement of frontal lobe volume on magnetic resonance imaging scans. Psych. Res. 1997;75:23–30. - PubMed
    1. Barritt J, Brooksbank M, Simpson D. Scaphocephaly: aesthetic and psychosocial considerations. Dev. Med. Child Neurol. 1981;23:183–191. - PubMed
    1. Barta P, Dhingra L, Royall R, Schwartz E. Improving stereological estimates for the volume of structures identified in three-dimensional arrays of spatial data. J. Neurosci. Meth. 1997;75:111–118. - PubMed

Publication types

LinkOut - more resources