Comparative Study
. 2005 Aug;94(2):1358-71.
doi: 10.1152/jn.01316.2004. Epub 2005 Apr 7.

Topographic maps of visual spatial attention in human parietal cortex

Affiliations
Comparative Study

Topographic maps of visual spatial attention in human parietal cortex

Michael A Silver et al. J Neurophysiol. 2005 Aug.

Erratum in

  • J Neurophysiol. 2006 Feb;95(2):1291

Abstract

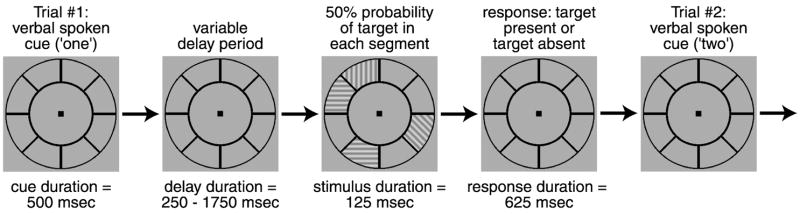
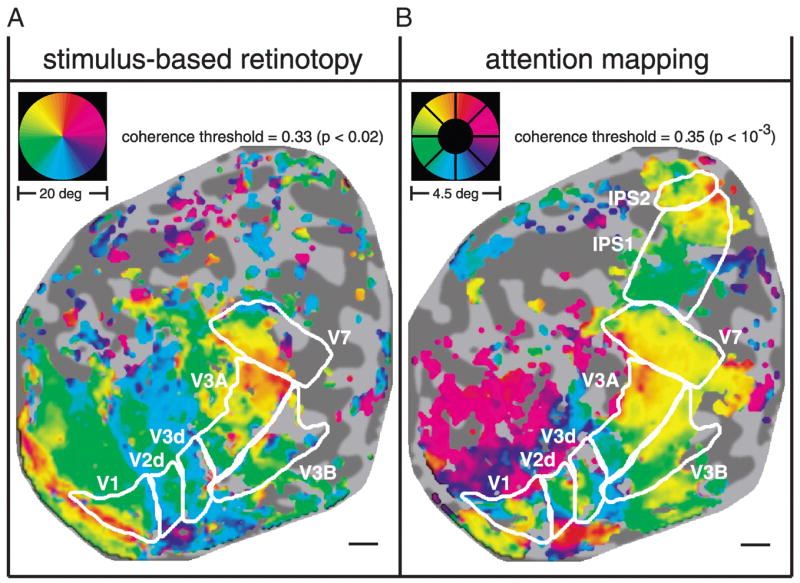
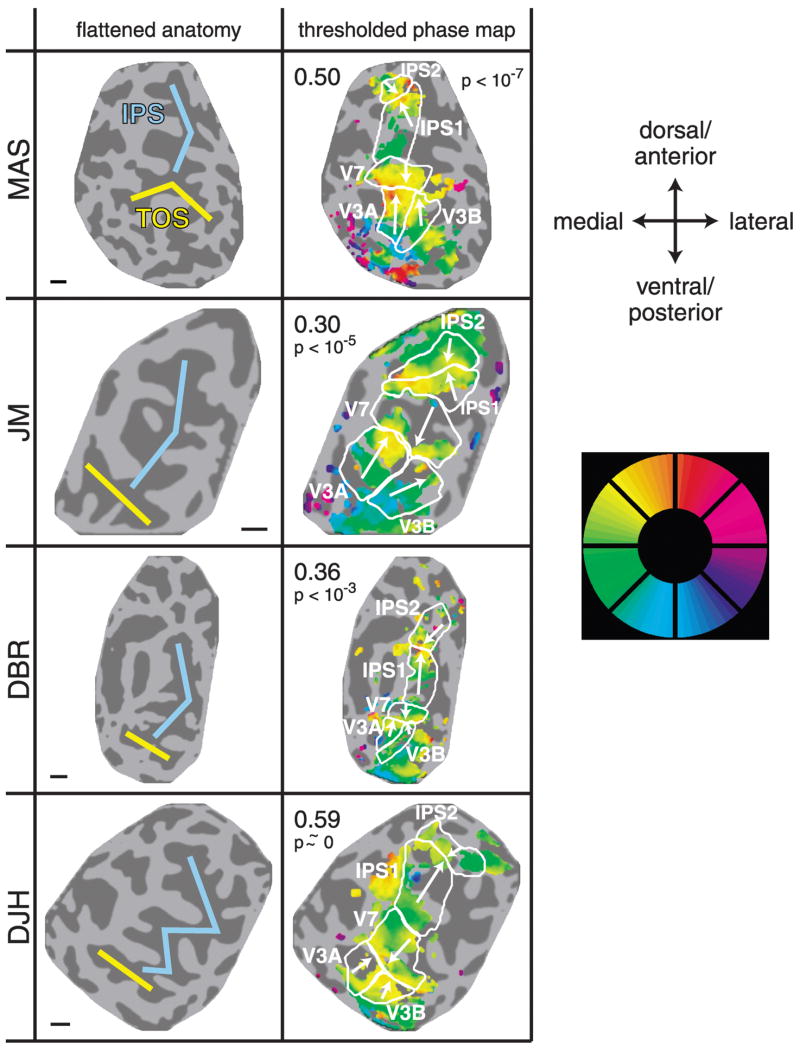
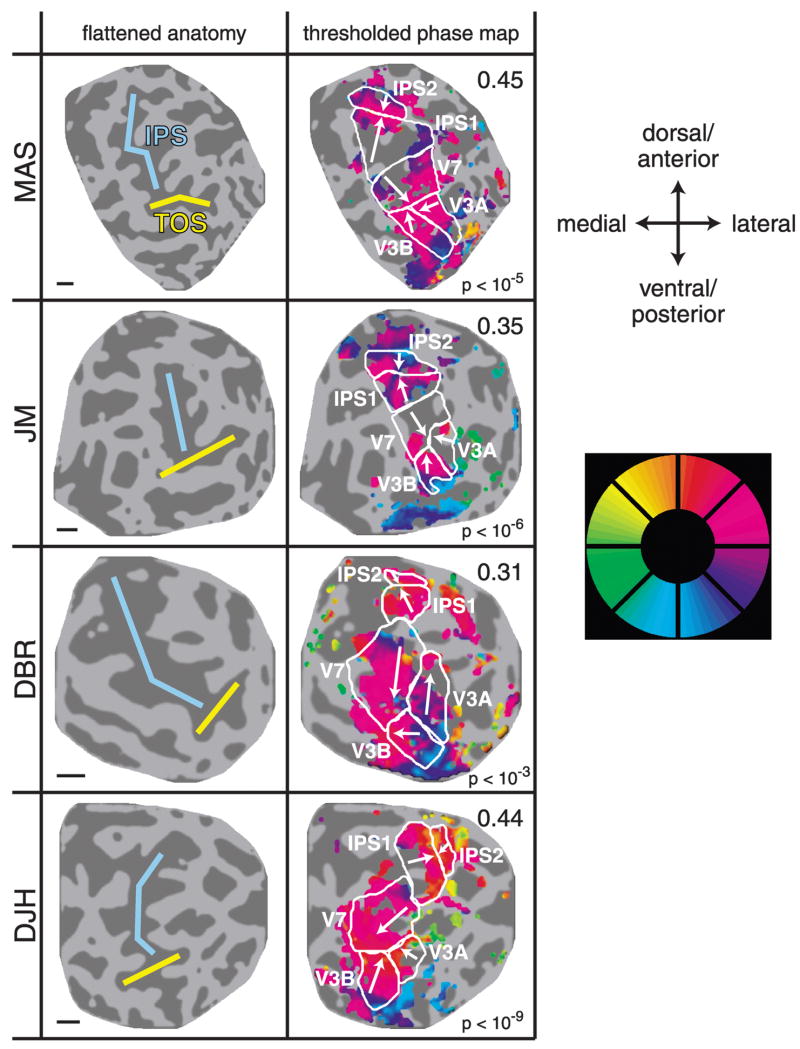
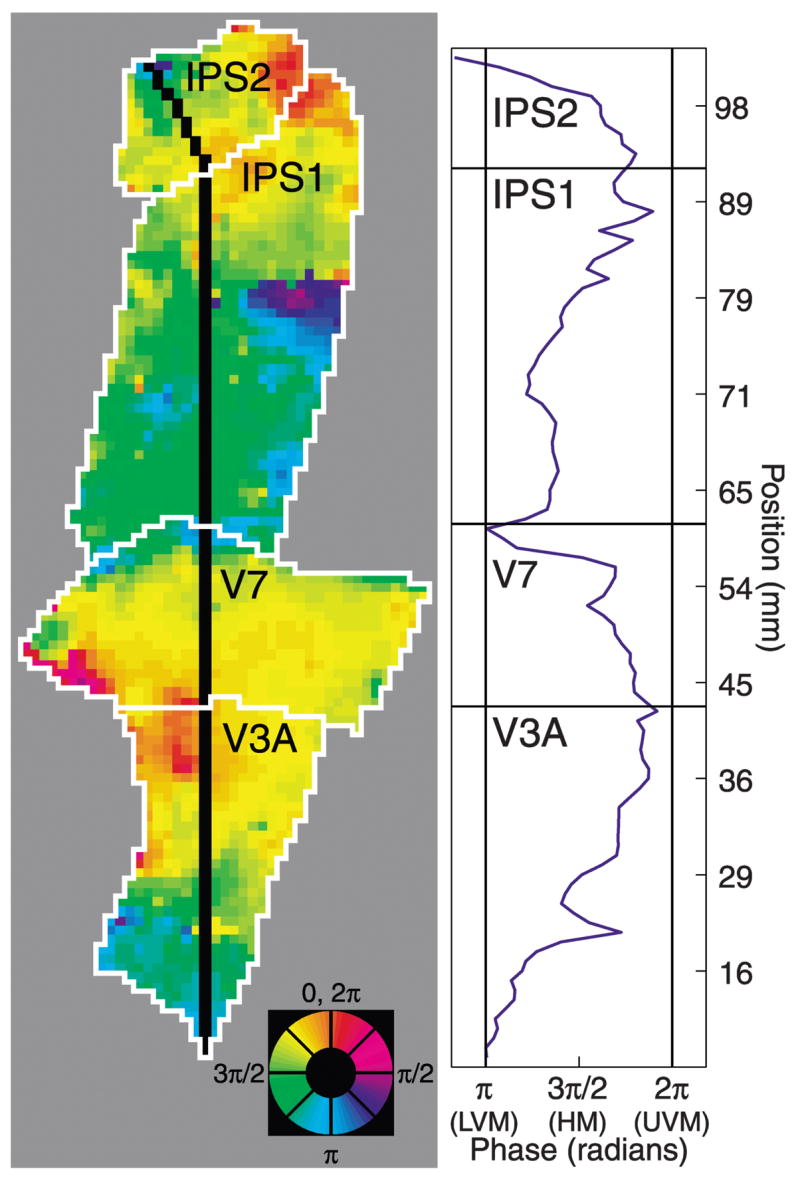
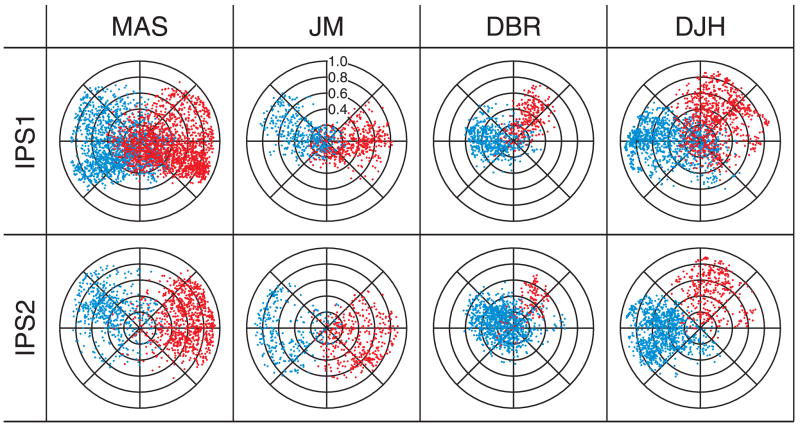
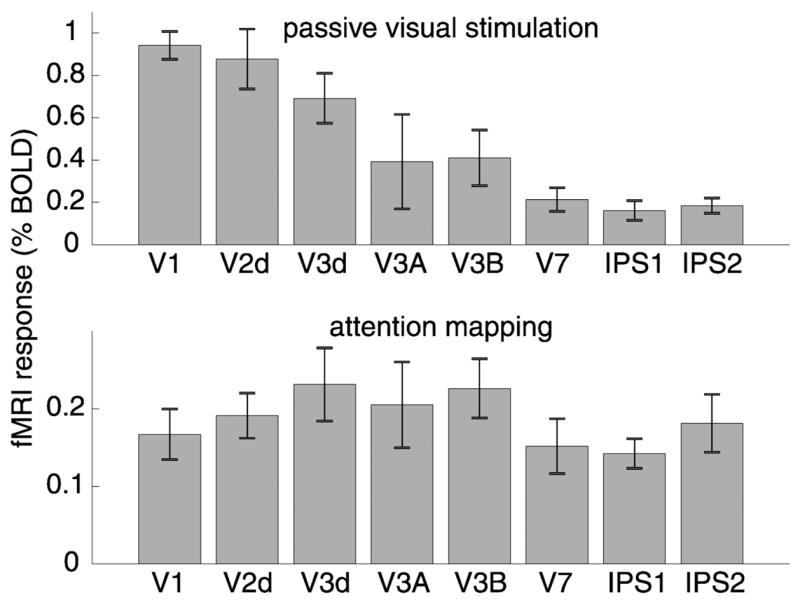
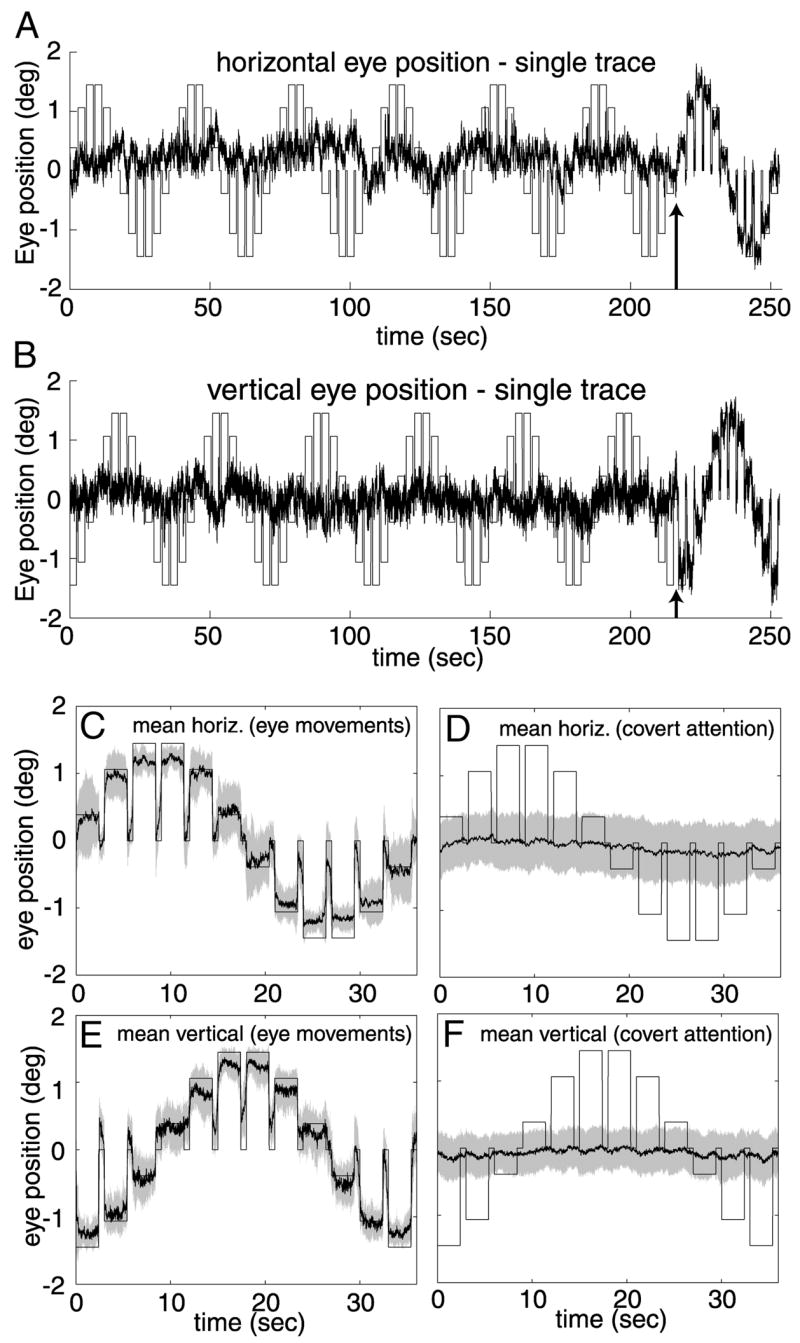
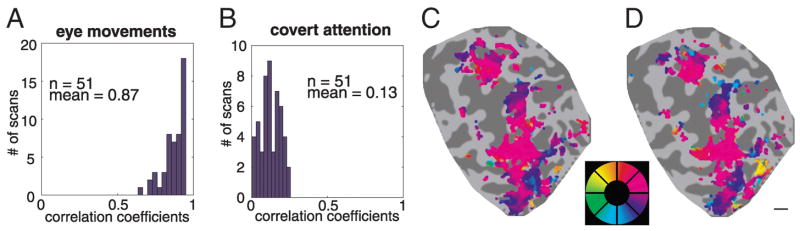
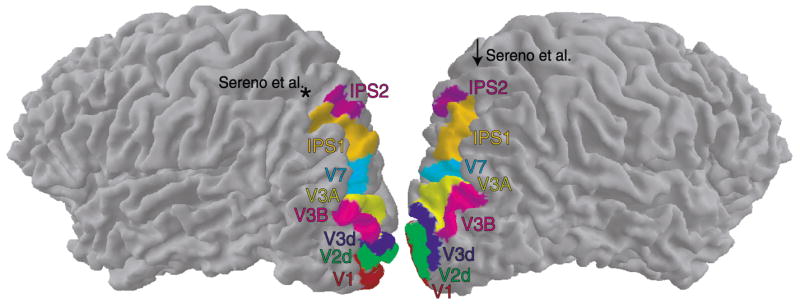
Functional magnetic resonance imaging (fMRI) was used to measure activity in human parietal cortex during performance of a visual detection task in which the focus of attention systematically traversed the visual field. Critically, the stimuli were identical on all trials (except for slight contrast changes in a fully randomized selection of the target locations) whereas only the cued location varied. Traveling waves of activity were observed in posterior parietal cortex consistent with shifts in covert attention in the absence of eye movements. The temporal phase of the fMRI signal in each voxel indicated the corresponding visual field location. Visualization of the distribution of temporal phases on a flattened representation of parietal cortex revealed at least two distinct topographically organized cortical areas within the intraparietal sulcus (IPS), each representing the contralateral visual field. Two cortical areas were proposed based on this topographic organization, which we refer to as IPS1 and IPS2 to indicate their locations within the IPS. This nomenclature is neutral with respect to possible homologies with well-established cortical areas in the monkey brain. The two proposed cortical areas exhibited relatively little response to passive visual stimulation in comparison with early visual areas. These results provide evidence for multiple topographic maps in human parietal cortex.


Figures

Fig. 1
Fig. 1
Covert attention-mapping task used to generate maps of attention-related activity. Each trial began with an electronically synthesized spoken cue that corresponded to one of the segments in the annulus. After a variable delay period, a grating was presented with 50% probability, independently in each segment. An auditory click then signaled subjects to respond with a button press indicating whether a target was present or absent in the cued segment. After the response, the next trial began with another verbal cue that directed attention to one of the adjacent segments, either ascending in number (clockwise scans) or descending (counterclockwise scans). Total trial duration was 3 s. Subjects were instructed to maintain fixation throughout each scan and responded only to the cued segment on each trial. Only the cued segment varied systematically over time. Although there were visual stimuli presented on every trial, there was no systematic pattern of visual stimulation.
Fig. 2
Fig. 2
Correspondence between stimulus-based retinotopic and attention-related maps. A: angular component of retinotopic maps, measured using conventional visual stimulation (see RESULTS for details). Gray scale: flattened representation of cortical anatomy corresponding to occipital and parietal cortex (subject MAS, right hemisphere). Dark shading corresponds to sulci and lighter shading to gyri. Color: fMRI response phase. Color wheel inset: corresponding angular position in the visual field. Colors are displayed for all gray matter locations that exceeded the indicated coherence threshold. For each panel, the P value corresponding to the coherence threshold (see METHODS) is also shown. Scale bar, about 1 cm. B: attention-related maps (same format as A). Indicated visual areas V1 through V7 were defined using stimulus-based retino-topic mapping, i.e., copied from A. In addition, there are two additional cortical maps, labeled IPS1 and IPS2, that are not evident in the stimulus-evoked retinotopic maps.
Fig. 3
Fig. 3
Right hemisphere attention-related maps in parietal cortex for all 4 subjects. Left column: flattened representations of posterior parietal cortex. Cyan curve, intraparietal sulcus (IPS); yellow curve, transverse occipital sulcus (TOS). Right column: fMRI response phases with cortical area boundaries superimposed (same format as Fig. 2). Indicated areas V3A, V3B, and V7 were defined using stimulus-based retinotopic mapping. Proposed IPS1 and IPS2 areas were defined based on the attention-mapping results. Coherence thresholds were chosen separately for each hemisphere and are displayed next to the thresholded phase maps. For each map, the P value corresponding to the chosen coherence threshold is also shown. Arrows indicate visual field orientation, pointing toward the upper vertical meridian and away from the lower vertical meridian representation. Scale bars, about 1 cm.
Fig. 4
Fig. 4
Left hemisphere attention-related maps in parietal cortex for all 4 subjects (same format as Fig. 3).
Fig. 5
Fig. 5
Phase progressions within cortical areas and phase reversals between adjacent areas. Left: unthresholded, unsmoothed attention-related maps (subject MAS, right hemisphere). Black line indicates linear region of interest (ROI). Color wheel: angular position in the visual field. Right: response phase as a function of position along the black line. In each cortical area, the phases span the entire contralateral visual field. Vertical meridian representations occur at the boundaries between cortical areas and are associated with reversals of phase. Distances were measured in the folded cortical manifold (the boundary between the cortical white and gray matter) to avoid spatial distortions inherent in the flattening process (Dougherty et al. 2003).
Fig. 6
Fig. 6
Attention-related responses in IPS1 and IPS2 represent the contralateral visual hemifield. Each point corresponds to a single gray matter voxel. Red points are from left hemispheres and blue points are from right hemispheres. Angular position represents visual field location within the attended annulus, and radial position is the coherence coefficient. Although the maps in Fig. 3 and Fig. 4 are thresholded and display only those voxels most correlated with the attention cycle, the plots in this figure include every voxel within each of the cortical areas.
Fig. 7
Fig. 7
Responses to passive visual stimulation and attention. A: fMRI response amplitudes to passive visual stimulation with a high-contrast visual stimulus. B: fMRI response amplitudes during performance of the attention-mapping task (with very low-contrast visual stimuli). For a given cortical area, the response amplitudes were computed for each subject and then averaged across subjects (n = 4). Error bars: SE.
Fig. 8
Fig. 8
Eye position during attention mapping. A: single example of horizontal eye position recorded in the MR scanner from subject DJH. Black trace, measured eye position. Bars, expected horizontal eye position if the subject made eye movements to the attended segment on every trial. At the time point indicated by the arrow, the screen was blanked for 1.2 s, instructing the subject to make saccades to the attended segment on the subsequent trials. B: vertical eye position from the same example shown in A. C: mean horizontal eye position during performance of the eye movement trials for subject DJH. Shaded region, ±1 SD. D: mean horizontal eye position during performance of the covert attention task. E: mean vertical eye position during eye movement trials. F: mean vertical eye position during covert attention trials. Eye position was very weakly correlated with the cued location when the subject was instructed to maintain fixation.
Fig. 9
Fig. 9
Small bias in fixation toward the cued locations does not account for the observed topographic organization obtained with attention mapping. A: histogram of the correlation between the measured eye positions and the cued locations for blocks of trials in which subjects moved their eyes to the cued locations. Each event in the histogram corresponds to eye position data from a single scan (about 5 min), derived from 6 scanning sessions (2 for subject MAS and 4 for subject DJH) during which eye movements were recorded. B: histogram of correlation coefficients from covert attention trials. Correlation coefficients are small but significantly greater than zero. C: maps derived during covert attention from scans with low (<0.122 in panel B) correlation coefficients (subject MAS, left hemisphere, same format as Fig. 2). D: maps derived again during covert attention but from scans with high (>0.122 in panel B) correlation coefficients. Maps in C and D are virtually identical, indicating that eye movements were very unlikely to substantially contribute to the observed topographic pattern of activity. Scale bar, 1 cm.
Fig. 10
Fig. 10
Locations of topographic cortical areas. Left and right hemispheres are rotated 25° from the lateral view to display more of the posterior surfaces. Topographically organized cortical areas tile the cortex continuously from V1 well into posterior parietal cortex. Asterisk: location of the Talairach coordinates corresponding to the center of the map reported in Sereno et al. (2000) in the left hemisphere. Arrow: location of the Sereno et al. map in the right hemisphere (not visible from this viewpoint). In both hemispheres of this subject (MAS), the center of the Sereno et al. map lies well outside the boundaries of IPS1 and IPS2.

References

    1. Andersen RA, Buneo CA. Intentional maps in posterior parietal cortex. Annu Rev Neurosci. 2002;25:189–220. - PubMed
    1. Bashinski HS, Bacharach VR. Enhancement of perceptual sensitivity as the result of selectively attending to spatial locations. Percept Psychophys. 1980;28:241–248. - PubMed
    1. Ben Hamed S, Duhamel J-R, Bremmer F, Graf W. Representation of the visual field in the lateral intraparietal area of macaque monkeys: a quantitative receptive field analysis. Exp Brain Res. 2001;140:127–144. - PubMed
    1. Bisley JW, Goldberg ME. Neuronal activity in the lateral intraparietal area and spatial attention. Science. 2003;299:81–86. - PubMed
    1. Blatt GJ, Andersen RA, Stoner GR. Visual receptive field organization and cortico-cortical connections of the lateral intraparietal area (area LIP) in the macaque. J Comp Neurol. 1990;299:421–445. - PubMed

Publication types

MeSH terms