Assessment by flow cytometry of cytokine production in malnourished children
- PMID: 15817757
- PMCID: PMC1074380
- DOI: 10.1128/CDLI.12.4.502-507.2005
Assessment by flow cytometry of cytokine production in malnourished children
Abstract
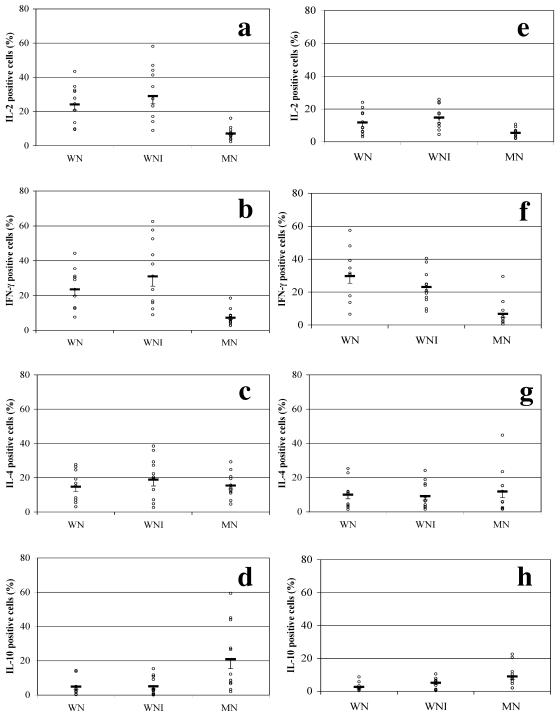
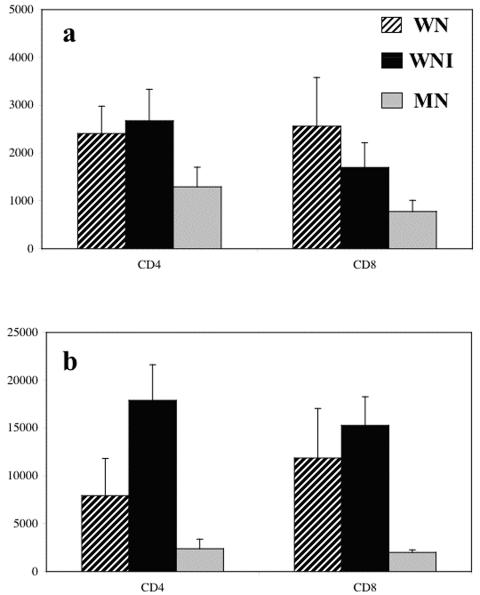
Malnutrition in children is associated with an increased risk of infection and death. Multiple abnormalities in the immune response, including cytokine production, in protein energy-malnourished children have been described and could account for the increased severity and frequency of infections. In this study, we used flow cytometry to investigate the effects of malnutrition on the production of cytokines (interleukin-2 [IL-2], gamma interferon [IFN-gamma], IL-4, and IL-10) in CD4+ and CD8+ cells and the activation capability (as indicated by CD69+ and CD25+ cells). CD4+ and CD8+ cells from malnourished children showed increased production of IL-4 and IL-10 cytokines and decreased production of IL-2 and IFN-gamma cytokines compared to that in cells from well-nourished, uninfected and well-nourished, infected children. In addition, malnourished children showed impaired activation capability, since the fluorescence intensity of CD69+ and CD25+ cells was lower than that in cells from well-nourished, uninfected and well-nourished, infected children. These results indicate that malnutrition alters the capacity of CD4+ and CD8+ cells to produce IL-2, IFN-gamma, IL-4, and IL-10 in response to stimulus. We concluded that both cytokine production and activation capacity were impaired in malnourished children. This functional impairment may be involved in the failure to develop a specific immune response and the predisposition to infection in these children.
Figures
References
-
- Anonymous. 1999. Management of severe malnutrition: a manual for physicians and other senior health workers. World Health Organization, Geneva, Switzerland.
-
- Caruso, A., S. Licenziati, M. Corulli, A. D. Canaris, M. A. de Francesco, S. Fiorentini, L. Peroni, F. Fallacara, F. Dima, A. Balsari, and A. Turano. 1997. Flow cytometric analysis of activation markers on stimulated T cells and their correlation with cell proliferation. Cytometry 27:71-76. - PubMed
-
- Chalmers, I. M. H., G. Janossy, M. Contreras, and C. Navarrete. 1998. Intracellular cytokine profile of cord and adult blood lymphocytes. Blood 92:11-18. - PubMed
-
- Chan, J., K. Tanaka, C. Mannion, D. Carroll, M. Tsang, Y. Xing, C. Lowenstein, and B. Bloom. 1997. Effects of protein calorie malnutrition on mice infected with BCG. J. Nutr. Immunol. 5:11-19.
Publication types
MeSH terms
Substances
LinkOut - more resources
Full Text Sources
Other Literature Sources
Medical
Research Materials