

Adipose tissue in muscle: a novel depot similar in size to visceral adipose tissue
- PMID: 15817870
- PMCID: PMC1482784
- DOI: 10.1093/ajcn/81.4.903
Adipose tissue in muscle: a novel depot similar in size to visceral adipose tissue
Abstract
Background: The manner in which fat depot volumes and distributions, particularly the adipose tissue (AT) between the muscles, vary by race is unknown.
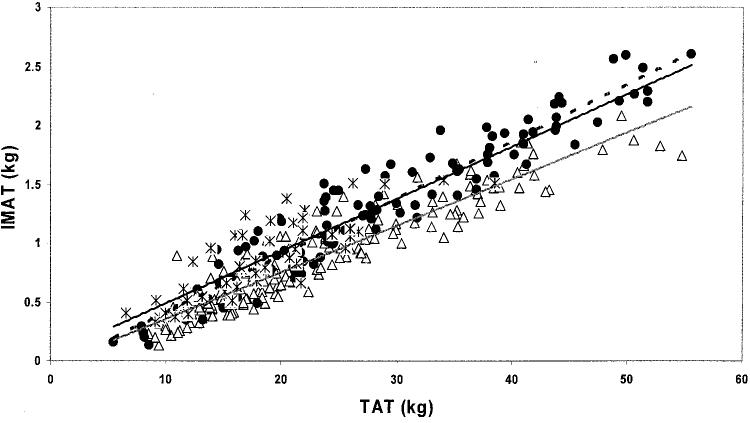
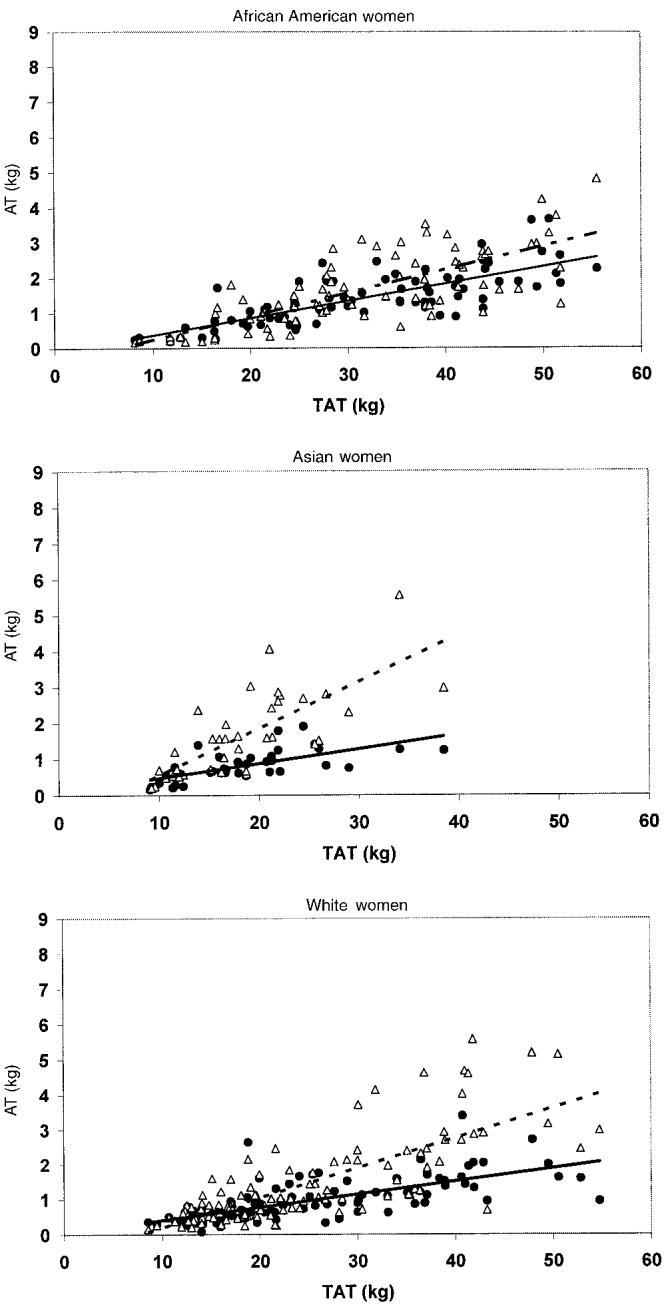
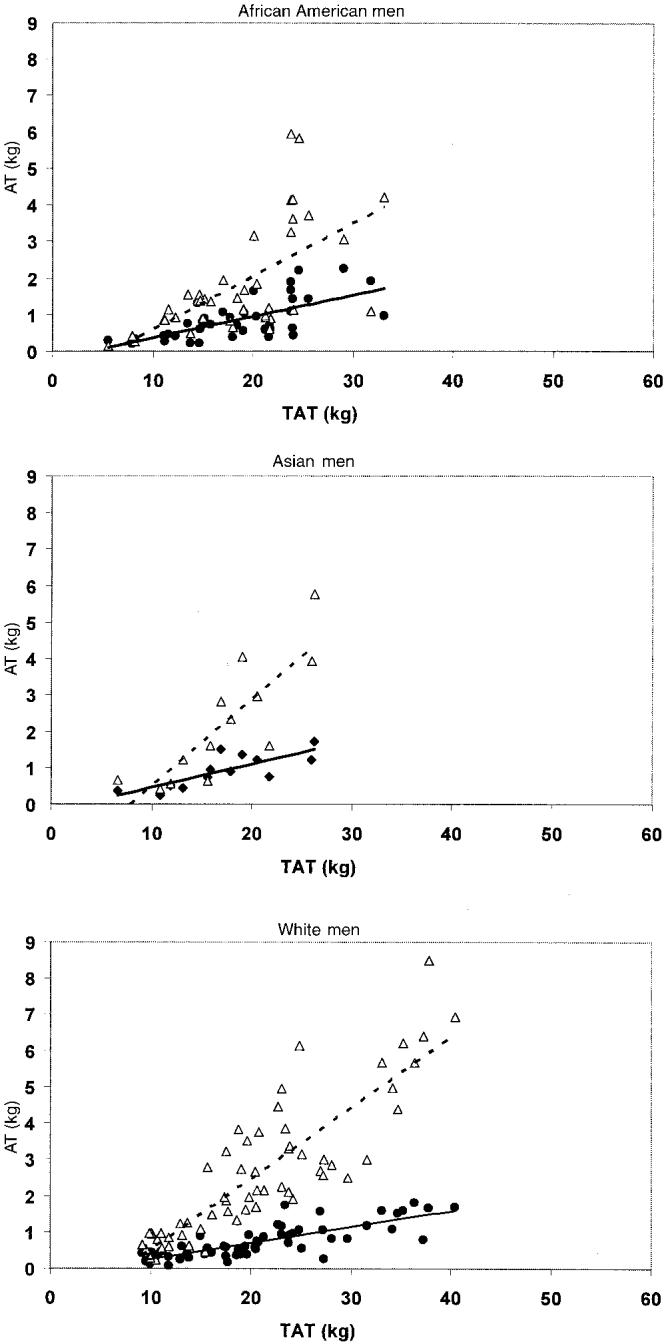
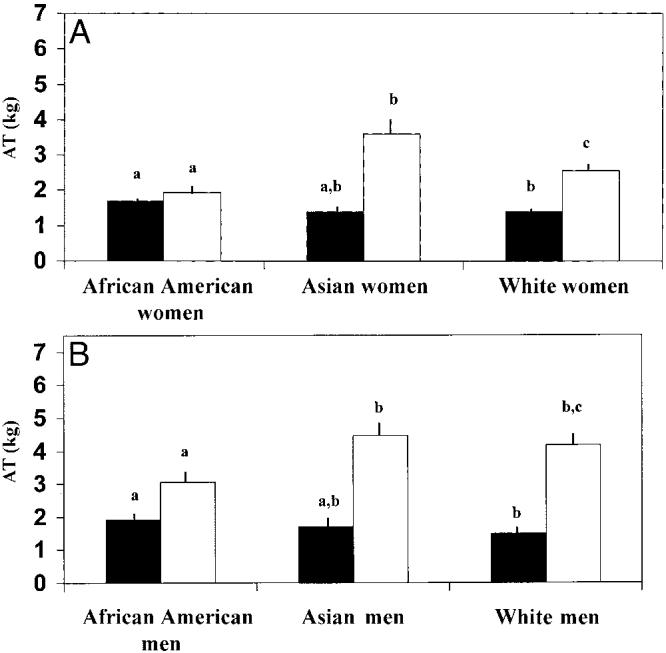
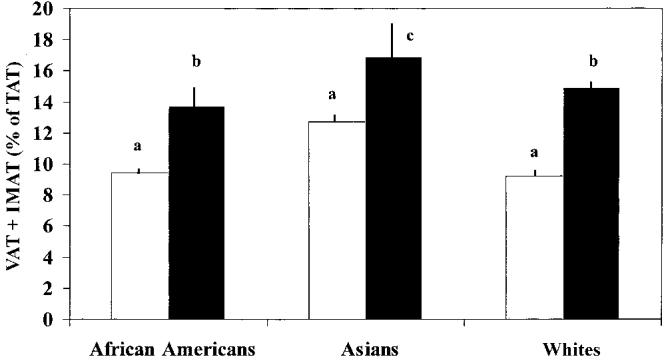
Objective: The objective was to quantify a previously unstudied and novel intermuscular AT (IMAT) depot and subcutaneous AT, visceral AT (VAT), and total-body skeletal muscle mass in healthy sedentary African American (AA), Asian, and white adults by whole-body magnetic resonance imaging. IMAT is the AT between muscles and within the boundary of the muscle fascia.
Design: Analyses were conducted on 227 women [AA (n = 79): body mass index (BMI; in kg/m(2)), 29.0 +/- 5.5; age, 45.7 +/- 16.9 y; Asian (n = 38): BMI, 21.7 +/- 2.9; age, 47.2 +/- 19.9 y; whites (n = 110): BMI, 24.9 +/- 5.4; age, 43.7 +/- 16.2 y]) and 111 men [AA (n = 39): BMI, 25.6 +/- 3.2; age, 45.5 +/- 18.8 y; Asian (n = 13): BMI, 24.9 +/- 2.5; age, 45.6 +/- 25.0 y; white (n = 59): BMI, 25.8 +/- 3.8; age 44.5 +/- 16.3 y].
Results: IMAT depots were not significantly different in size between race groups at low levels of adiposity; however, with increasing adiposity, AAs had a significantly greater increment in the proportion of total AT (TAT) than did the whites and Asians (58, 46, and 44 g IMAT/kg TAT, respectively; P = 0.001). VAT depots were not significantly different in size at low levels of adiposity but, with increasing adiposity, VAT accumulation was greater than IMAT accumulation in the Asians and whites; no significant differences were observed in AAs.
Conclusion: Race differences in AT distribution extend to IMAT, a depot that may influence race-ethnicity differences in dysglycemia.
Figures
Comment in
-
Racial differences in fat distribution: the importance of intermuscular fat.Am J Clin Nutr. 2005 Apr;81(4):731-2. doi: 10.1093/ajcn/81.4.731. Am J Clin Nutr. 2005. PMID: 15817844 No abstract available.
Similar articles
-
Sarcopenia and increased adipose tissue infiltration of muscle in elderly African American women.Am J Clin Nutr. 2004 May;79(5):874-80. doi: 10.1093/ajcn/79.5.874. Am J Clin Nutr. 2004. PMID: 15113728
-
Intermuscular adipose tissue rivals visceral adipose tissue in independent associations with cardiovascular risk.Int J Obes (Lond). 2007 Sep;31(9):1400-5. doi: 10.1038/sj.ijo.0803621. Epub 2007 Apr 24. Int J Obes (Lond). 2007. PMID: 17452994 Free PMC article.
-
Greater adipose tissue infiltration in skeletal muscle among older men of African ancestry.J Clin Endocrinol Metab. 2009 Aug;94(8):2735-42. doi: 10.1210/jc.2008-2541. Epub 2009 May 19. J Clin Endocrinol Metab. 2009. PMID: 19454588 Free PMC article.
-
The Metabolic Significance of Intermuscular Adipose Tissue: Is IMAT a Friend or a Foe to Metabolic Health?Diabetes. 2021 Nov;70(11):2457-2467. doi: 10.2337/dbi19-0006. Diabetes. 2021. PMID: 34711670 Review.
-
Intermuscular adipose tissue in metabolic disease.Nat Rev Endocrinol. 2023 May;19(5):285-298. doi: 10.1038/s41574-022-00784-2. Epub 2022 Dec 23. Nat Rev Endocrinol. 2023. PMID: 36564490 Review.
Cited by
-
Comparison of clinical semi-quantitative assessment of muscle fat infiltration with quantitative assessment using chemical shift-based water/fat separation in MR studies of the calf of post-menopausal women.Eur Radiol. 2012 Jul;22(7):1592-600. doi: 10.1007/s00330-012-2404-7. Epub 2012 Mar 13. Eur Radiol. 2012. PMID: 22411305 Free PMC article.
-
Validity of muscle thickness-based prediction equation for quadriceps femoris volume in middle-aged and older men and women.Eur J Appl Physiol. 2016 Dec;116(11-12):2125-2133. doi: 10.1007/s00421-016-3464-1. Epub 2016 Sep 2. Eur J Appl Physiol. 2016. PMID: 27590314
-
Adipose Tissue Distribution, Inflammation and Its Metabolic Consequences, Including Diabetes and Cardiovascular Disease.Front Cardiovasc Med. 2020 Feb 25;7:22. doi: 10.3389/fcvm.2020.00022. eCollection 2020. Front Cardiovasc Med. 2020. PMID: 32158768 Free PMC article. Review.
-
Imaging body composition in obesity and weight loss: challenges and opportunities.Diabetes Metab Syndr Obes. 2010 Sep 28;3:337-47. doi: 10.2147/DMSOTT.S9454. Diabetes Metab Syndr Obes. 2010. PMID: 21437103 Free PMC article.
-
Neck circumference is associated with adipose tissue content in thigh skeletal muscle in overweight and obese premenopausal women.Sci Rep. 2020 May 20;10(1):8324. doi: 10.1038/s41598-020-65204-9. Sci Rep. 2020. PMID: 32433484 Free PMC article.
References
-
- Rexrode KM, Carey VJ, Hennekens CH, et al. Abdominal adiposity and coronary heart disease in women. JAMA. 1998;280:1843–8. - PubMed
-
- Kannel WB, Cupples LA, Ramaswami R, Stokes J, III, Kreger BE, Higgins M. Regional obesity and risk of cardiovascular disease; the Framingham Study. J Clin Epidemiol. 1991;44:183–90. - PubMed
-
- Kissebah AH, Vydelingum N, Murray R, et al. Relation of body fat distribution to metabolic complications of obesity. J Clin Endocrinol Metab. 1982;54:254–60. - PubMed
-
- Conway JM, Yanovski SZ, Avila NA, Hubbard VS. Visceral adipose tissue differences in black and white women. Am J Clin Nutr. 1995;61:765–71. - PubMed
Publication types
MeSH terms
Grants and funding
LinkOut - more resources
Full Text Sources
Medical
