

Power and sample size calculations in the presence of phenotype errors for case/control genetic association studies
- PMID: 15819990
- PMCID: PMC1131899
- DOI: 10.1186/1471-2156-6-18
Power and sample size calculations in the presence of phenotype errors for case/control genetic association studies
Abstract
Background: Phenotype error causes reduction in power to detect genetic association. We present a quantification of phenotype error, also known as diagnostic error, on power and sample size calculations for case-control genetic association studies between a marker locus and a disease phenotype. We consider the classic Pearson chi-square test for independence as our test of genetic association. To determine asymptotic power analytically, we compute the distribution's non-centrality parameter, which is a function of the case and control sample sizes, genotype frequencies, disease prevalence, and phenotype misclassification probabilities. We derive the non-centrality parameter in the presence of phenotype errors and equivalent formulas for misclassification cost (the percentage increase in minimum sample size needed to maintain constant asymptotic power at a fixed significance level for each percentage increase in a given misclassification parameter). We use a linear Taylor Series approximation for the cost of phenotype misclassification to determine lower bounds for the relative costs of misclassifying a true affected (respectively, unaffected) as a control (respectively, case). Power is verified by computer simulation.
Results: Our major findings are that: (i) the median absolute difference between analytic power with our method and simulation power was 0.001 and the absolute difference was no larger than 0.011; (ii) as the disease prevalence approaches 0, the cost of misclassifying a unaffected as a case becomes infinitely large while the cost of misclassifying an affected as a control approaches 0.
Conclusion: Our work enables researchers to specifically quantify power loss and minimum sample size requirements in the presence of phenotype errors, thereby allowing for more realistic study design. For most diseases of current interest, verifying that cases are correctly classified is of paramount importance.
Figures
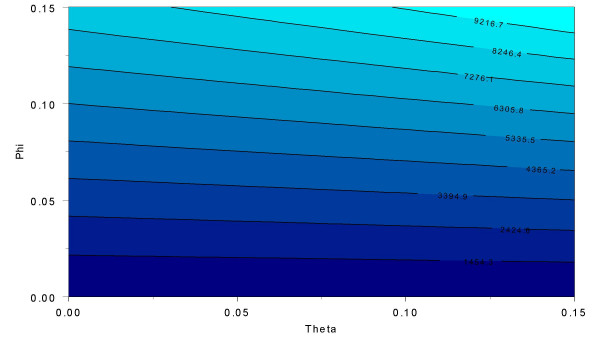
 ) needed to maintain constant 95% asymptotic power at the 5% significance level (using a central χ2 distribution with 5 degrees of freedom) in the presence of errors. Sample sizes are computed using equation (3). The affected and unaffected genotype frequencies are taken from a previous publication [9, 14]. In that work, the marker locus considered was ApoE and the disease phenotype was Alzheimer's disease. We use the LRTae estimates from table 5 of that work [9]. Six genotypes are observed in most populations. The frequencies we use to perform the sample size calculations in figure 1 are presented in the Methods section (Minimum sample size requirements in presence of phenotype misclassification – Alzheimer's Disease ApoE example). We assume that equal numbers of cases and controls are collected. Also, we specify a prevalence K = 0.02, which is consistent with recent published reports for Alzheimer's Disease in the U. S. [32]. Sample sizes are calculated for each misclassification parameter θ, φ ranging from 0.0 to 0.15 in increments of 0.01. The number of cases ranges from 484 when θ = φ = 0 to 10,187 when θ = φ = 0.15. In this figure, each (approximately) horizontal line represents a constant sample size as a function of the misclassification parameters θ and φ. For two consecutive horizontal lines, the values in between those lines (represented by different colors) have sample sizes that are between the sample sizes indicated by the two horizontal lines.
References
-
- Breslow NE, Day NE. The Analysis of Case-Control Studies. Eighth. Vol. 1. Lyon, International Agency for Research on Cancer; 1980. Statistical Methods in Cancer Research; p. 350. - PubMed
-
- Ott J. Analysis of Human Genetic Linkage. Baltimore, The Johns Hopkins University Press; 1999.
-
- Rice JP, Saccone NL, Rasmussen E. Definition of the phenotype. Adv Genet. 2001;42:69–76. - PubMed
-
- Bross I. Misclassification in 2 x 2 tables. Biometrics. 1954;10:478–486.
MeSH terms
Substances
Grants and funding
LinkOut - more resources
Full Text Sources
