. 2005 Apr 11;33(7):2061-77.
doi: 10.1093/nar/gki336. Print 2005.

NMR chemical shift and relaxation measurements provide evidence for the coupled folding and binding of the p53 transactivation domain

Affiliations

NMR chemical shift and relaxation measurements provide evidence for the coupled folding and binding of the p53 transactivation domain

Pamela D Vise et al. Nucleic Acids Res. .

Abstract

The interaction between the acidic transactivation domain of the human tumor suppressor protein p53 (p53TAD) and the 70 kDa subunit of human replication protein A (hRPA70) was investigated using heteronuclear magnetic resonance spectroscopy. A 1H-15N heteronuclear single quantum coherence (HSQC) titration experiment was performed on a 15N-labeled fragment of hRPA70, containing the N-terminal 168 residues (hRPA701-168) and p53TAD. HRPA701-168 residues important for binding were identified and found to be localized to a prominent basic cleft. This binding site overlapped with a previously identified single-stranded DNA-binding site, suggesting that a competitive binding mechanism may regulate the formation of p53TAD-hRPA70 complex. The amide 1H and 15N chemical shifts of an uniformly 15N-labeled sample of p53TAD were also monitored before and after the addition of unlabeled hRPA701-168. In the presence of unlabeled hRPA701-168, resonance lineshapes increased and corresponding intensity reductions were observed for specific p53TAD residues. The largest intensity reductions were observed for p53TAD residues 42-56. Minimal binding was observed between p53TAD and a mutant form of hRPA701-168, where the basic cleft residue R41 was changed to a glutamic acid (R41E), demonstrating that ionic interactions play an important role in specifying the binding interface. The region of p53TAD most affected by binding hRPA701-168 was found to have some residual alpha helical and beta strand structure; however, this structure was not stabilized by binding hRPA701-168. 15N relaxation experiments were performed to monitor changes in backbone dynamics of p53TAD when bound to hRPA701-168. Large changes in both the transverse (R2) and rotating frame (R1) relaxation rates were observed for a subset of the p53TAD residues that had 1H-15N HSQC resonance intensity reductions during the complex formation. The folding of p53TAD upon complex formation is suggested by the pattern of changes observed for both R2 and R1. A model that couples the formation of a weak encounter complex between p53TAD and hRPA701-168 to the folding of p53TAD is discussed in the context of a functional role for the p53-hRPA70 complex in DNA repair.


Figures

Figure 1
Figure 1
Linear schematic diagrams showing the functional domains of hRPA70 and p53. Beneath the schematic diagrams are the primary sequences of hRPA701–168 and p53TAD. The hRPA701–168 basic cleft residues and the p53TAD negatively charged residue pairs are underlined in each sequence.
Figure 2
Figure 2
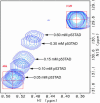
Overlapping 1H–15N HSQC spectra for A59 and A128 resonances obtained during titration between hRPA701–168 and p53TAD. A59 participates in binding while A128 does not. Spectra were collected at 298K.
Figure 3
Figure 3
(a) Ribbon diagram of DBD F showing the position on the structure of residues with the largest chemical shift changes upon binding p53TAD colored red. (b) Ribbon diagram of DBD F showing the position on the structure of residues with the largest chemical shift changes upon binding ssDNA colored red. For (a) and (b), the N- and C-termini and the positively charged residues that form the DBD F basic cleft are labeled. (c) Schematic representation of the secondary structure and linear sequence for hRPA70 residues 1–123. β-Strands are labeled with arrows, α-helices are labeled with cylinders, and loop and coil regions are labeled with lines. The α3 helix is colored gray to reflect its reduced stability (9). Shown in red below the sequence are the hRPA701–168 residues with the largest chemical shift changes upon binding either p53TAD or ssDNA.
Figure 4
Figure 4
Selected regions of the assigned 1H–15N HSQC spectra of 0.30 mM uniformly 15N-labeled p53TAD. The left panel shows p53TAD alone and the right panel shows p53TAD after the addition of unlabeled hRPA701–168 to a concentration of 0.30 mM. Both spectra were collected at 278K.
Figure 5
Figure 5
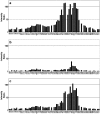
The calculated intensity ratios for p53TAD after the addition of (a) hRPA701–168, (b) R41E and (c) Y118A.
Figure 6
Figure 6
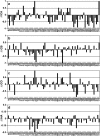
Plots showing secondary chemical shifts for p53TAD based on resonance assignments obtained at 298K. The random coil chemical shift standard used in the analysis was developed by Wishart et al. (74). (a) Plot of 13Cα Δδ values, (b) plot of13Cβ Δδ values, (c) plot of 13CO Δδ values and (d) plot of 1Hα Δδ values.
Figure 7
Figure 7
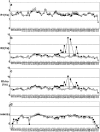
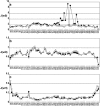
Plots showing relaxation data for p53TAD (open circles) and p53TAD plus unlabeled hRPA701–168 (closed circles). (a) Plot of the longitudinal relaxation rates, R1, labeled R1; (b) plot of the transverse relaxation rates, R2, labeled R2; (c) plot of the rotating frame relaxation rates, R, labeled R1rho; and (d) plot of the 1H–15N NOE labeled NHNOE. Error bars are shown for the noisiest datasets, which in all cases is for bound p53TAD. For most of the p53TAD residues, error values are smaller than the data markers.
Figure 8
Figure 8
Plots of reduced spectral density mapping data for p53TAD (open circles) and p53TAD plus unlabeled hRPA701–168 (closed circles). (a) Plot of the spectral density at zero frequency, J(0), labeled J(w0); (b) plot of the spectral density at the 15N frequency, JN), labeled J(wN); and (c) plot of the spectral density at the 1H frequency, JH), labeled J(wH). Error bars are shown for the noisiest datasets, which in all cases is for bound p53TAD. For most of the p53TAD residues, error values are smaller than the data markers.
Figure 9
Figure 9
Model for p53–hRPA70 disassociation. Prior to DNA damage p53 and hRPA70 form a complex. When DNA damage occurs, hRPA70 binds and stabilizes the open complex. When this occurs DBD A and B will bind the undamaged strand. This will enhance the weak ssDNA-binding affinity of DBD F presumably to the point where p53 is released.

Similar articles

Cited by

References

    1. Friedberg E.C. Correcting the Blueprint of Life: An Historical Account of the Discovery of DNA Repair Mechanisms. Cold Spring Harbor, NY: Cold Spring Harbor Laboratory Press; 1997. pp. 17–19. 91–96.
    1. Friedberg E.C., Walker G.C., Siede W. DNA Repair and Mutagenesis. Washington, DC: ASM Press; 1995. pp. 1–29. 1–92.
    1. Lindahl T., Karran P., Wood R.D. DNA excision repair pathways. Curr. Opin. Genet. Dev. 1997;7:158–169. - PubMed
    1. Wallace S.S., Van Houten B., Kow Y.W. DNA Damage: Effect on DNA Structure and Protein Recognition. Annals of the New York Academy of Sciences; 1994. pp. 92–105.
    1. Wold M.S. Replication protein A: a heterotrimeric, single-stranded DNA-binding protein required for eukaryotic DNA metabolism. Annu. Rev. Biochem. 1997;66:61–92. - PubMed

Publication types

MeSH terms