Comparative Study
. 2005 Apr 18;201(8):1205-15.
doi: 10.1084/jem.20041948. Epub 2005 Apr 11.

Intestinal antiinflammatory effect of 5-aminosalicylic acid is dependent on peroxisome proliferator-activated receptor-gamma

Affiliations
Comparative Study

Intestinal antiinflammatory effect of 5-aminosalicylic acid is dependent on peroxisome proliferator-activated receptor-gamma

Christel Rousseaux et al. J Exp Med. .

Abstract

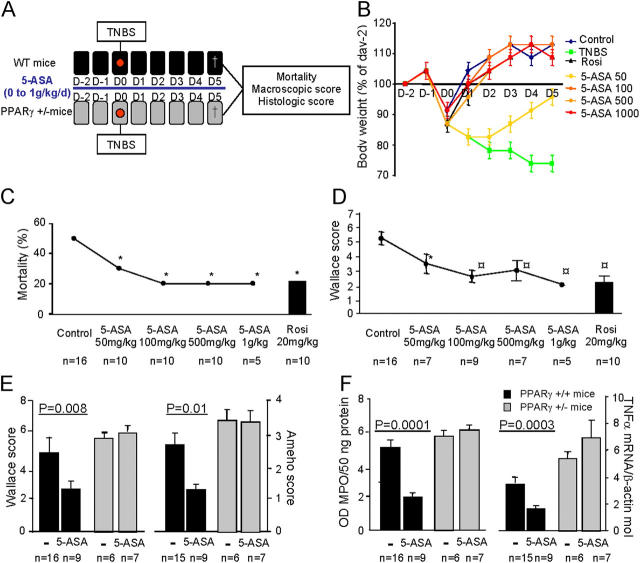
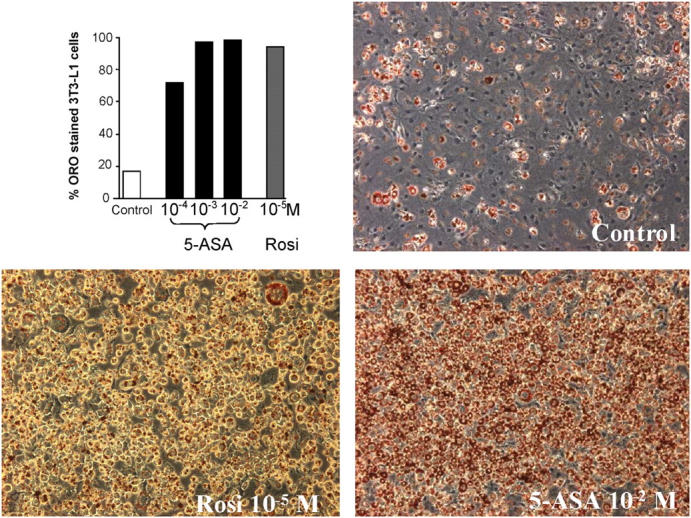
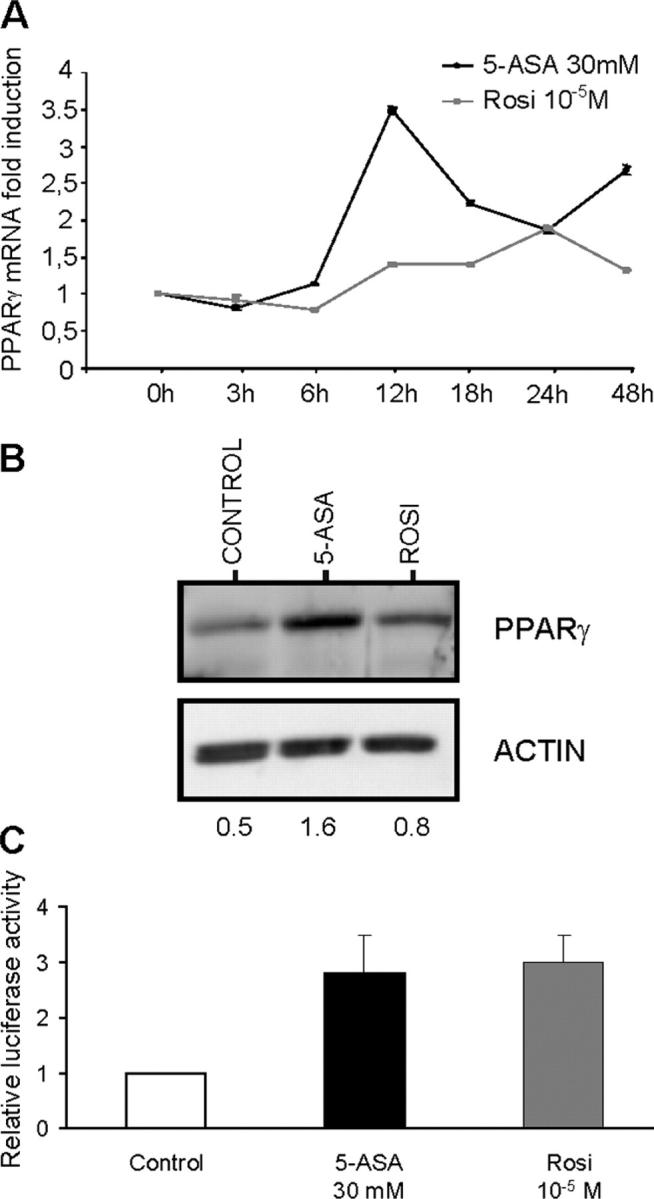
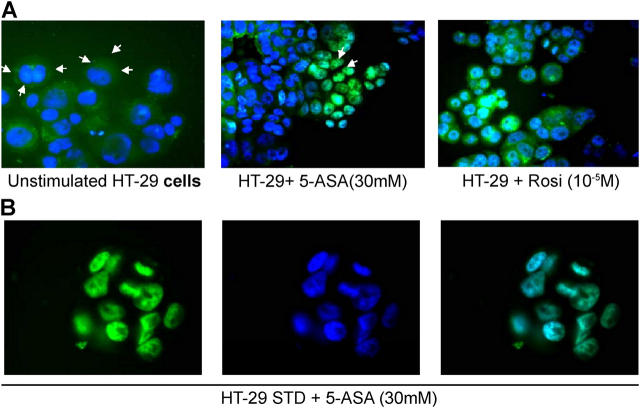
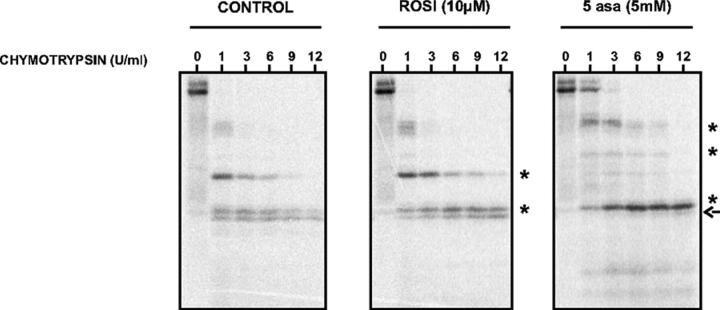
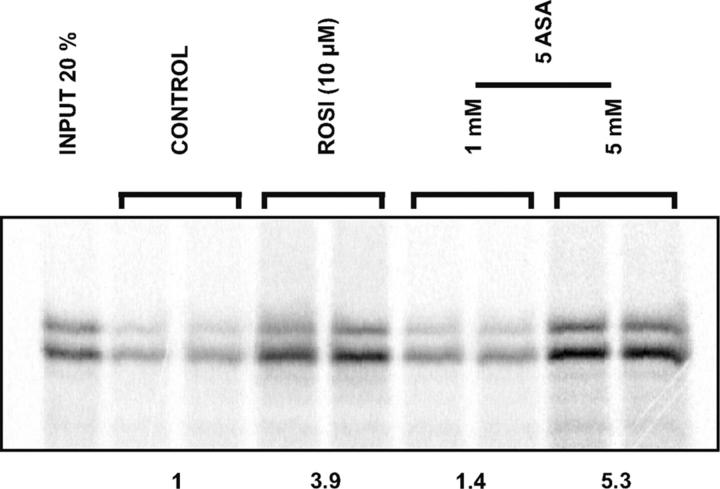
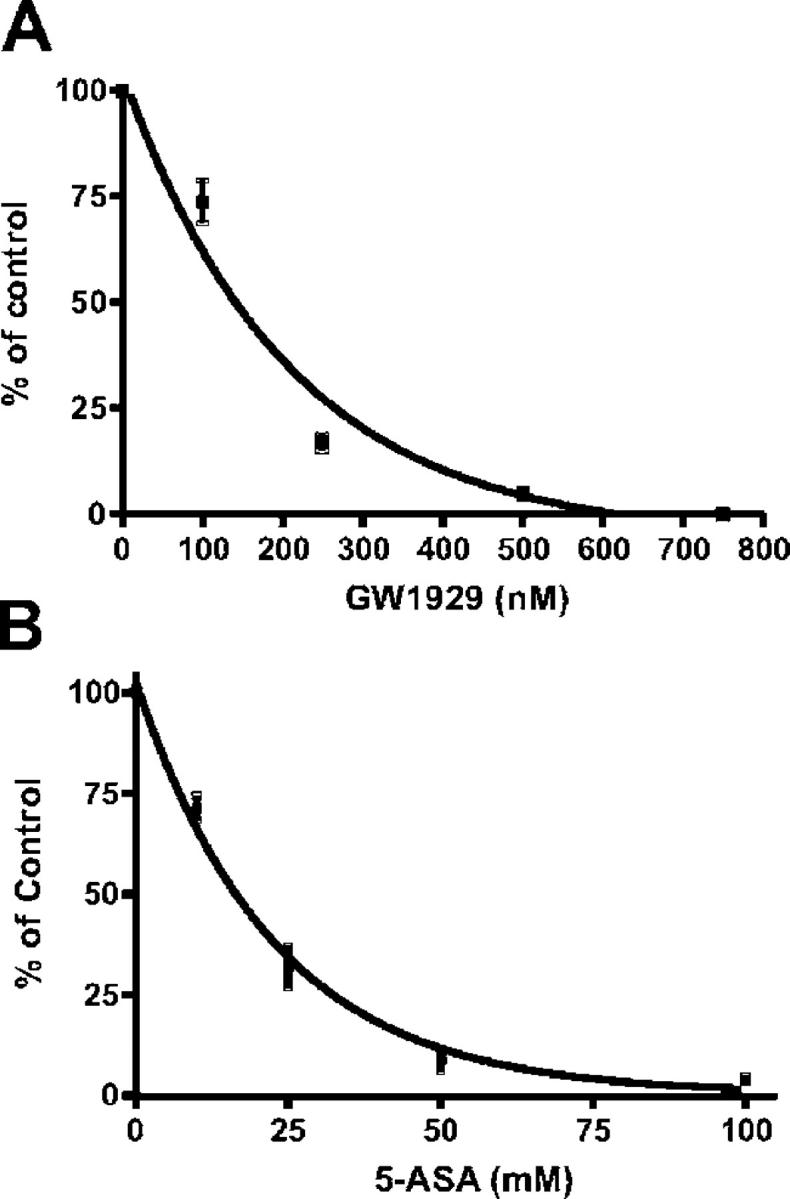
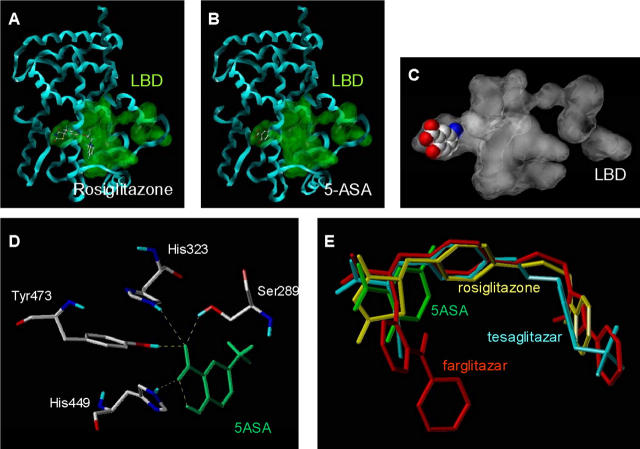
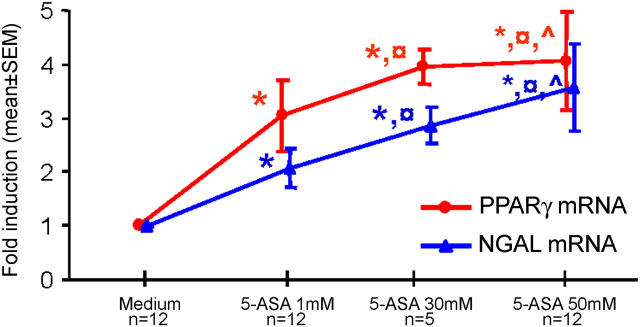
5-aminosalicylic acid (5-ASA) is an antiinflammatory drug widely used in the treatment of inflammatory bowel diseases. It is known to inhibit the production of cytokines and inflammatory mediators, but the mechanism underlying the intestinal effects of 5-ASA remains unknown. Based on the common activities of peroxisome proliferator-activated receptor-gamma (PPAR-gamma) ligands and 5-ASA, we hypothesized that this nuclear receptor mediates 5-ASA therapeutic action. To test this possibility, colitis was induced in heterozygous PPAR-gamma(+/-) mice and their wild-type littermates, which were then treated with 5-ASA. 5-ASA treatment had a beneficial effect on colitis only in wild-type and not in heterozygous mice. In epithelial cells, 5-ASA increased PPAR-gamma expression, promoted its translocation from the cytoplasm to the nucleus, and induced a modification of its conformation permitting the recruitment of coactivators and the activation of a peroxisome-proliferator response element-driven gene. Validation of these results was obtained with organ cultures of human colonic biopsies. These data identify PPAR-gamma as a target of 5-ASA underlying antiinflammatory effects in the colon.


Figures

Figure 1.
Figure 1.
Colon inflammation in PPAR-γ heterozygous mice is refractory to 5-ASA therapy. (A) Colitis was induced by intrarectal administration of TNBS in wild-type mice (black) and PPARγ+/− mice (gray). Animals were killed 5 d later to evaluate the intensity of colitis. (B–D) A detailed dose–response study was performed with oral 5-ASA given daily and compared with untreated animals with colitis (control) or receiving an optimal dosage (20 mg/kg) of rosiglitazone (rosi). 5-ASA effects were analyzed according to the evolution of (B) body weight, (C) mortality, and (D) macroscopic Wallace scores. (E and F) To evaluate whether the antiinflammatory role of 5-ASA in the colon was mediated by PPAR-γ, we compared the antiinflammatory effects of the most efficient dosage of 5-ASA in wild-type mice (black) and in PPARγ+/− mice (gray). In contrast with wild-type mice, 5-ASA was ineffective in PPARγ+/− mice and did not modify (E) macroscopic and histologic lesions evaluated by the Wallace and Ameho scores, respectively, or (F) the colonic molecular markers of inflammation such as myeloperoxidase (MPO) and the production of TNF-α. The number of mice and statistical significance are indicated. Results are expressed as the mean ± SEM. *, P < 0.05 compared with untreated mice with colitis; , P < 0.01 compared with untreated mice with colitis.
Figure 2.
Figure 2.
5-ASA induces differentiation of 3T3-L1 cells. The adipogenic effect of different concentrations of 5-ASA (from 10−4 M to 10−2 M) was evaluated in 3T3-L1 preadipocytes and compared with rosiglitazone (rosi, 10−5 M). After 4 d of culture, only 17 ± 4% of cells incubated with medium alone (control) showed enhanced intracytosolic accumulation of lipid droplets monitored by Oil Red O (ORO) staining. Treatment with the different concentrations of 5-ASA and rosiglitazone induced a marked differentiation of 3T3-L1 cells. Results are expressed as the mean ± SEM number of stained cells counted in four different experiments.
Figure 3.
Figure 3.
Induction and activation of PPAR-γ expression in 5-ASA–treated epithelial cells. (A) PPAR-γ mRNA expression was quantified by real-time PCR in HT-29 STD cells incubated for 3, 6, 12, 18, 24, and 48 h with 5-ASA (30 mM) or rosiglitazone (10−5 M). The main induction of PPAR-γ mRNA expression was observed at 12 h in cells incubated with 5-ASA. Results were expressed as the mean ± SEM of six different experiments. (B) The level of PPAR-γ protein expression was evaluated by Western blot assay in untreated HT-29 cells (control) and after 24 h of 5-ASA (30 mM) or rosiglitazone (rosi, 10−5 M) treatment. OD values of PPAR-γ were given for each condition in proportion to the quantity of the internal control β-actin in the same sample. (C) Activation of PPAR-γ by 5-ASA. HT-29 STD cells transfected with the response element for PPAR-γ (2XCYP) and treated by 5-ASA (30 mM) or rosiglitazone (10−5 M) showed a similar, approximately threefold induction of PPAR-γ reporter gene activity indicating the ability of 5-ASA to induce PPAR-γ activation. Results are expressed as fold activation (mean ± SEM) compared with untreated cells.
Figure 4.
Figure 4.
Intracellular localization of PPAR-γ in epithelial cells. (A) HT-29 STD cells transfected with GFP-tagged PPAR-γ were incubated in the presence of medium alone (unstimulated cells), 5-ASA (30 mM), or rosiglitazone (rosi, 10−5 M) for 24 h. Nuclear staining in blue was performed with Hoescht 33342 solution. The intracellular distribution of the fluorescent tags was examined under a fluorescence microscope. (B) HT-29 STD cells transfected with GFP-tagged PPAR-γ incubated in the presence of 5-ASA (30 mM) for 24 h. Green color represents PPAR-γ (left); blue color represents the nucleus (middle); merged green and blue pictures illustrate the translocation of PPAR-γ into the cell nucleus (right).
Figure 5.
Figure 5.
Protease protection assay of PPAR-γ in presence of 5-ASA or rosiglitazone. Difference in protease sensitivity of 5-ASA–bound and rosiglitazone-bound PPAR-γ compared with nonliganded PPAR-γ (control). Autoradiogram of an SDS-PAGE gel showing [35S]methionine-labeled full-length human PPAR-γ2 digested with chymotrypsin. Asterisks and arrow denote chymotrypsin-resistant and chymotrypsin-sensitive-protein fragments, respectively.
Figure 6.
Figure 6.
GST pull-down assays with PPAR-γ incubated with 5-ASA or rosiglitazone. The GST-DRIP fusion protein bound to glutathione-sepharose beads was incubated with medium alone (control), 5-ASA (1 and 5 mM), or rosiglitazone (10−5 M) in the presence of [35S]methionine-labeled PPAR-γ. Autoradiograms of SDS-PAGE gel show higher amounts of the coactivator DRIP bound to PPAR-γ in the presence of 5-ASA and rosiglitazone than in the control. The amount of PPAR-γ bound to coactivator in the presence of the indicated ligands is expressed as fold induction relative to that measured in absence of ligand (control, defined as 1). Each sample was processed in duplicate.
Figure 7.
Figure 7.
5-ASA binding assay for PPAR-γ. A competitive binding assay was performed with 40 nM [3H]-rosiglitazone in the presence or absence of (A) PPAR-γ agonist GW1929 (0–800 nM, Sigma-Aldrich) used as positive control or (B) increasing concentrations of nonradioactive 5-ASA (0–100 mM). 5-ASA competed with rosiglitazone for binding to PPAR-γ. The specific binding obtained with [3H]rosiglitazone alone was 100% of control. Results are expressed as the mean ± SEM in four different experiments.
Figure 8.
Figure 8.
Docking simulation of the PPAR-γ binding mode of 5-ASA. Comparison of the interaction of (A) rosiglitazone and (B) 5-ASA colored by atom type in the ligand-binding domain (LBD) represented by a green surface in the X-ray crystal structure of PPAR-γ displayed as a blue ribbon. (C) 5-ASA displayed in space-filling representation colored by atom type fitted tightly within the PPAR-γ LBD represented as a white surface. (D) Key hydrogen binding interactions (dotted line) between 5-ASA and PPAR-γ. (E) Similar binding mode of 5-ASA model and crystallographic conformation of tesaglitazar, farglitazar, and rosiglitazone.
Figure 9.
Figure 9.
5-ASA induces PPAR-γ expression and activation in organ cultures of human colonic biopsies. Levels of PPAR-γ mRNA (red) and its target gene NGAL (blue) quantified by real-time PCR in human colon biopsies after 24 h of culture with medium alone and three concentrations of 5-ASA (1, 30, and 50 mM). Results are expressed as the fold induction (mean ± SEM) compared with control (medium). The number of patients and statistical significance are indicated. *, P < 0.05 compared with controls; , P < 0.05 compared with 5-ASA (1 mM);^, P < 0.05 compared with 5-ASA (30 mM).

References

    1. Svartz, N. 1941. Ett nytt sulfonamidpreparat? Forelopande meddelande [Swedish]. Nord. Med. 9:544.
    1. Azad Khan, A.K., J. Piris, and S.C. Truelove. 1977. An experiment to determine the active therapeutic moiety of sulphasalazine. Lancet. 2:892–895. - PubMed
    1. Brogden, R.N., and E.M. Sorkin. 1989. Mesalazine. A review of its pharmacodynamic and pharmacokinetic properties, and therapeutic potential in chronic inflammatory bowel disease. Drugs. 38:500–523. - PubMed
    1. Greenfield, S.M., N.A. Punchard, J.P. Teare, and R.P. Thompson. 1993. The mode of action of the aminosalicylates in inflammatory bowel disease. Aliment. Pharmacol. Ther. 7:369–383. - PubMed
    1. Zhou, S.Y., D. Fleisher, L.H. Pao, C. Li, B. Winward, and E.M. Zimmermann. 1999. Intestinal metabolism and transport of 5-aminosalicylate. Drug Metab. Dispos. 27:479–485. - PubMed

Publication types