. 2005 Apr 11;169(1):127-38.
doi: 10.1083/jcb.200409140.

A Rho family GTPase controls actin dynamics and tip growth via two counteracting downstream pathways in pollen tubes

Affiliations

A Rho family GTPase controls actin dynamics and tip growth via two counteracting downstream pathways in pollen tubes

Ying Gu et al. J Cell Biol. .

Abstract

Tip growth in neuronal cells, plant cells, and fungal hyphae is known to require tip-localized Rho GTPase, calcium, and filamentous actin (F-actin), but how they interact with each other is unclear. The pollen tube is an exciting model to study spatiotemporal regulation of tip growth and F-actin dynamics. An Arabidopsis thaliana Rho family GTPase, ROP1, controls pollen tube growth by regulating apical F-actin dynamics. This paper shows that ROP1 activates two counteracting pathways involving the direct targets of tip-localized ROP1: RIC3 and RIC4. RIC4 promotes F-actin assembly, whereas RIC3 activates Ca(2+) signaling that leads to F-actin disassembly. Overproduction or depletion of either RIC4 or RIC3 causes tip growth defects that are rescued by overproduction or depletion of RIC3 or RIC4, respectively. Thus, ROP1 controls actin dynamics and tip growth through a check and balance between the two pathways. The dual and antagonistic roles of this GTPase may provide a unifying mechanism by which Rho modulates various processes dependent on actin dynamics in eukaryotic cells.


Figures
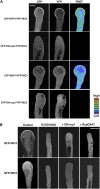
Figure 1.
Figure 1.
RIC3 and RIC4 are direct targets of ROP1 GTPase. (A) FRET analysis of in vivo ROP1 interaction with RIC3/RIC4. Tobacco pollen tubes coexpressing CFP-ROP1 or -DN-rop1 and YFP-RIC3 or -RIC4 were analyzed as described in the text. A pseudo-color scale with the intensity of FRET signals is displayed in the right panel (red, highest signal). All images were mid-plane sections. Bar, 10 μm. (B) Tip localization of RIC3/RIC4 requires their interaction with active ROP1. Control shows typical GFP-RIC4 or -RIC3 localization and tip morphology in tobacco pollen tubes transiently expressing LAT52:GFP-RIC4 or -RIC3, respectively. H37D/H40D shows tobacco tubes transiently expressing GFP-tagged RIC3 or RIC4 mutant (mutations in the two conserved histidine residues in the CRIB motif). DN-rop1 or RopGAP1 shows tubes coexpressing GFP-RIC3 or -RIC4 with DN-rop1 or RopGAP1, respectively. All images were mid-plane confocal optimal sections. Bar, 15 μm.
Figure 2.
Figure 2.
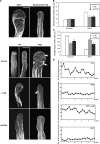
RIC4 promotes the assembly of dynamic tip F-actin. (A) RIC4 OX induced a stable F-actin network at the tip that was reversed by LatB or profilin. LAT52:GFP-mTalin was transiently expressed alone or coexpressed with LAT52:RIC4, LAT52:ROP1, or LAT52:RIC4H107DH110D in tobacco pollen tubes gown in the presence of 10 μM Ca2+. 5 h after bombardment, tubes were treated with 5 nM LatB for ∼1 h. For profilin experiments, LAT52:AtPFN3 was cooverexpressed with LAT52:GFP-mTalin and LAT52:RIC4 in untreated tubes. GFP-mTalin was analyzed by confocal microscopy as described previously (Fu et al., 2001). All images shown are projections of 1-μm sections. Arrowhead points at the stable actin network at the tip. Arrow indicates the end of the actin cables. Bar, 10 μm. A video (Video 1) showing the stable actin network is presented in the online supplemental material. (B and C) LatB or AtPFN3 suppressed RIC4 OX–induced depolarization of tobacco pollen tubes. All experiments were performed as described in A, and the maximum tip width and the length of pollen tubes were measured 1 h after LatB treatment or 6 h after bombardment. Data were collected from three individual experiments (∼50 tubes per experiment). Asterisk indicates a significant difference from WT at the same data point (P < 0.05; t test). (D) RIC4 OX–induced disruption of apical actin oscillation is suppressed LatB. Control (WT) and treatment experiments were performed as described in A. A time series (15-s intervals) of mid-plane confocal sections of tubes expressing GFP-mTalin was taken, and the average GFP intensity in a region of the apical dome (∼5 μm from the extreme apex) was determined as described previously (Fu et al., 2001). Normalized average GFP intensity was used to represent relative amounts of F-actin at the tip. Y axis values are arbitrary units of the normalized GFP intensity; x axis indicates time (min) starting from the first collected image. Cytosolic GFP was used as a negative control showing no significant oscillation of fluorescence in the identical region of the tube measured for GFP-talin oscillation.
Figure 3.
Figure 3.
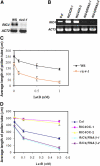
The phenotypic characterization of A. thaliana RIC4 mutant. (A) RT-PCR analysis of RIC4 mRNA expression in ric4-1 in fluorescence tissues. WS, Wassilewskija WT. ACTIN2 (ACT2) was used as a control for PCR amplification. (B) RT-PCR analysis of RIC4 expression in RIC4 OX and RIC4(RNAi). Both OX and RNAi constructs were transformed into Columbia (Col) WT plants. RNA from mature pollen was used for RT-PCR analysis. ACTIN3 (ACT3) was used as a control for PCR amplification. (C) The ric4-1 pollen tubes are more sensitive to LatB inhibition of growth. (D) The effect of LatB on the growth of RIC4 OX and RIC4(RNAi) pollen tubes. In both C and D, data were collected from three individual experiments (∼100 tubes per experiment). The y axis represents average lengths of pollen tubes measured 9–12 h after germination, whereas the x axis represents the concentrations of LatB used. Error bars indicate standard errors.
Figure 4.
Figure 4.
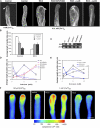
RIC3 regulates Ca 2+ signaling. (A) RIC3 OX–induced actin reorganization and depolarized growth were not suppressed by LatB. LAT52:RIC3 was transiently coexpressed with LAT52:GFP-mTalin in tobacco pollen tubes grown in the presence of 10 μM Ca2+. RIC3-overexpressing tubes were treated with 5 nM LatB (see Fig. 2 A) or with 100 μM LaCl3 (see panel B). Control tubes (expressing LAT52:GFP-mTalin alone) were cultured in the presence of 10 μM or 1 mM Ca2+. All images were projections of 1-μm confocal optical sections. Arrow, actin cables. Bar, 15 μm. A video (Video 2) showing actin cables protruding to the tip is presented in the online supplemental material. (B) Both EGTA and LaCl3 suppressed RIC3 OX–induced growth inhibition. EGTA and LaCl3 were included in growth medium at a final concentration of 1 mM and 100 μM, respectively. Data were collected from three individual experiments (∼50 tubes per experiment). Asterisk indicates a significant difference from WT at the same data point (P < 0.01; t test). (C) RT-PCR analysis of LAT52:RIC3 OX and LAT52:RIC3(RNAi) lines. RNA from mature A. thaliana pollen was used for RT-PCR analysis. ACTIN3 (ACT3) was used as a control for PCR amplification. Col, Columbia WT. (D) Increasing [Ca2+]ex suppressed RIC3(RNAi)-induced inhibition of pollen tube growth, whereas decreasing [Ca2+]ex rescued tube growth inhibited by RIC3 OX. Pollen grains from WT plants (Col) and plants homozygous for RIC3 OX and RIC3(RNAi) were germinated overnight on a medium containing 0.5, 2, 5, or 10 mM Ca2+. Data were collected from three individual experiments (≥100 tubes per experiment). (E) LaCl3 restored the RIC3 OX–induced shift of the Ca2+ response curve. LaCl3 was added into growth medium in a final concentration of 100 μM. Data were collected and analyzed as describe in D. (F) RIC3 OX sustained normal tip growth and tip-focused Ca2+ gradient at suboptimal [Ca2+]ex (100 μM) but led to delocalization and expansion of the tip gradient and swelling of the tube apex at 1 mM [Ca2+]ex. Pollen from Petunia inflata was cobombarded with LAT52:RIC3/LAT52:GFP or LAT52:RIC4/LAT52:GFP and then germinated at the indicated [Ca2+]ex. Tubes were then microinjected with the Ca2+ sensing dye Indo-1-dextran and Ca2+ was monitored by confocal ratio imaging. Ca2+ levels have been pseudo-color coded according to the inset scale. Bar, 15 μm.
Figure 5.
Figure 5.
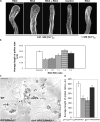
RIC3 and RIC4 coordinately counteract to control tip growth. (A) Cooverexpression of RIC3 and RIC4 restored normal tip growth and actin dynamics, similar to high [Ca2+]ex restoration of tip growth in RIC4-overexpressing tubes. LAT52:GFP-mTalin was expressed alone (control) or coexpressed with indicated RICs in tobacco pollen tubes cultured in medium containing the indicated [Ca2+]ex. All images were projections of 1-μm confocal optical sections. Bar, 20 μm. A video (Video 3) showing the dynamics of tip-localized GFP-mTalin is presented in the online supplemental material. (B) Normal tip growth requires a balance between RIC3 and RIC4. Varied amounts of LAT52:RIC3 and LAT52:RIC4 were coexpressed in tobacco pollen tubes. The number in the x axis indicates micrograms of LAT52:RIC3 or LAT52:RIC4 plasmid DNA used for bombardment. Data were collected from three individual experiments (∼50 tubes per experiment). Asterisk indicates a significant difference from WT at the same data point (P < 0.01; t test). (C) The RIC3 and RIC4 double knockdown mutant suppressed the pollen tube growth defect in single mutants. A. thaliana pollen grains of wild type (Wassilewskija WT), ric4-1, RIC3(RNAi)-1, and ric4-1/RIC3(RNAi)-1 were germinated on a growth medium (5 mM Ca2+) and photographed ∼6 h after germination. Bar, 120 μm. (D) Quantitative analysis of pollen tube elongation in different A. thaliana mutants. The length of pollen tubes as described in C was measured and data were collected from three individual experiments (∼100 tubes per experiment). Asterisk indicates a significant difference from WT at the same data point (P < 0.01; t test).
Figure 6.
Figure 6.
A model for the ROP GTPase control of actin dynamics and tip growth. The model predicts that ROP1 is activated at the tip and activates RIC4 and RIC3, which promote the assembly of tip F-actin and lead to the formation of tip-focused [Ca2+]cyt gradients, respectively. The two pathways check and balance to control actin dynamics and tip growth. The RIC4-dependent tip F-actin may target vesicles to the site of exocytosis as well as is required for the proper regulation of the RIC3 pathway. The RIC3-mediated Ca2+ promotes the disassembly of the tip F-actin, likely releasing F-actin blockage of vesicle fusion, and may also directly activate vesicle fusion. The dual and antagonistic roles of Rho signaling explain a dilemma for the regulation of exocytosis by Rho GTPase–dependent cortical F-actin; i.e., cortical F-actin is both required for and inhibits exocytosis. The check and balance of the two ROP1 downstream pathways also explain how the extremely polarized growth is coupled with growth oscillation in pollen tubes. Solid arrows indicate steps supported by experimental data described in this paper or elsewhere (Fu et al., 2001), whereas dotted arrows indicate more speculative steps. In addition to profilin, other potential Ca2+ sensors such as gelsolin, which might also be involved in RIC3-mediated actin disassembly, are not indicated in the model.

References

    1. Aspenstrom, P. 1999. Effectors of the Rho GTPases. Curr. Opin. Cell Biol. 11:95–102. - PubMed
    1. Bibikova, T.N., A. Zhigilei, and S. Gilroy. 1997. Root hair growth in Arabidopsis thaliana is directed by calcium and an endogenous polarity. Planta. 203:495–505. - PubMed
    1. Burbelo, P.D., D. Drechsel, and A. Hall. 1995. A conserved binding motif defines numerous candidate target proteins for both Cdc42 and Rac GTPases. J. Biol. Chem. 270:29071–29074. - PubMed
    1. Dickson, B.J. 2001. Rho GTPases in growth cone guidance. Curr. Opin. Neurobiol. 11:103–110. - PubMed
    1. Etienne-Manneville, S., and A. Hall. 2002. Rho GTPases in cell biology. Nature. 420:629–635. - PubMed

Publication types

MeSH terms