

Two essential but distinct functions of the mammalian abasic endonuclease
- PMID: 15824325
- PMCID: PMC556297
- DOI: 10.1073/pnas.0500986102
Two essential but distinct functions of the mammalian abasic endonuclease
Abstract
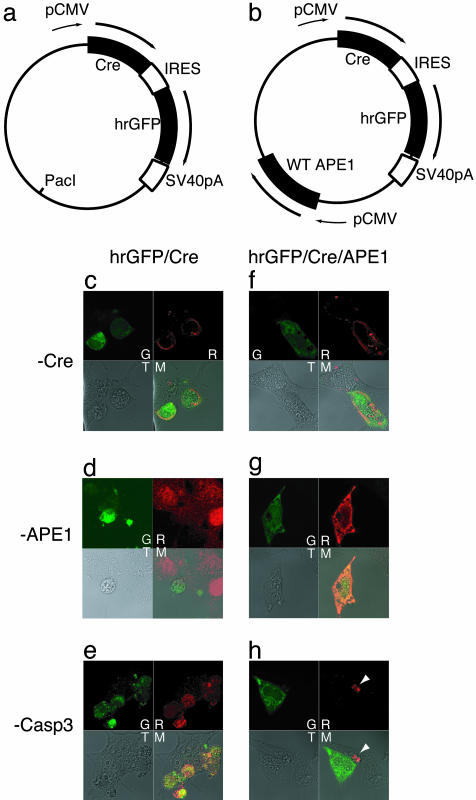
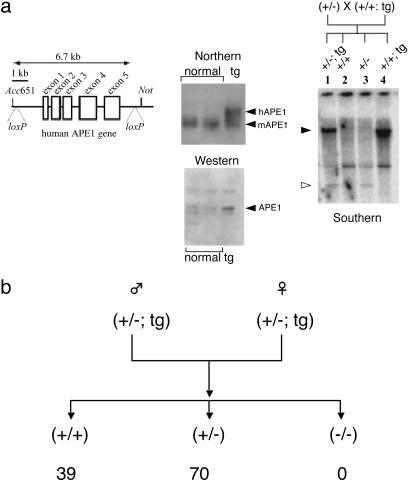
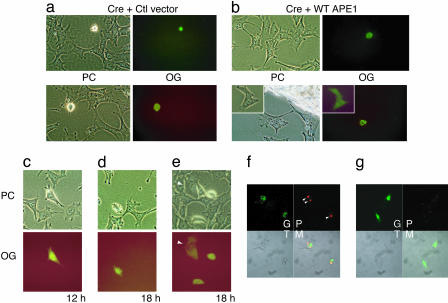
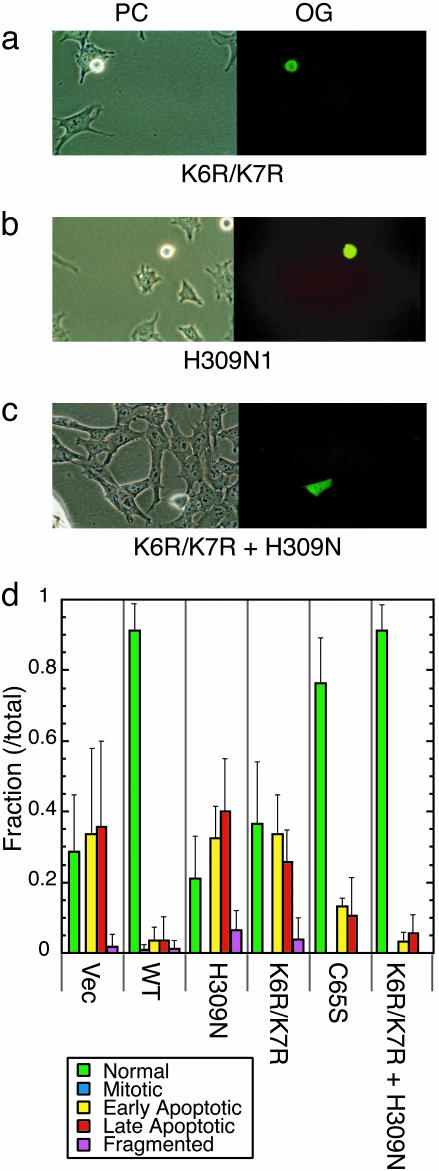
The mammalian abasic endonuclease, APE1, has two distinct roles in the repair of oxidative DNA damage and in gene regulation. Here we show that both functions are essential for cell survival. Deletion of the APE1 gene causes embryonic lethality in mice, and no nullizygous embryo fibroblasts have been isolated. We have now established nullizygous embryo fibroblast lines from APE1(-/-) mouse embryos that are transgenic with the "floxed" human APE1 (hAPE1) gene. Removal of hAPE1 by Cre expression through nuclear microinjection elicited apoptosis in these cells within 24 h, which was blocked by coinjection of the wild-type hAPE1 gene. In contrast, mutant hAPE1 alleles, lacking either the DNA repair or acetylation-mediated gene regulatory function, could not prevent apoptosis, although the combination of these two mutants complemented APE deficiency induced by Cre. These results indicate that distinct and separable functions of APE1 are both essential for mammalian cells even in vitro and provide the evidence that mammalian cells, unlike yeast or Escherichia coli, absolutely require APE for survival, presumably to protect against spontaneous oxidative DNA damage.
Figures
Similar articles
-
Intracellular trafficking and regulation of mammalian AP-endonuclease 1 (APE1), an essential DNA repair protein.DNA Repair (Amst). 2007 Apr 1;6(4):461-9. doi: 10.1016/j.dnarep.2006.10.010. Epub 2006 Dec 12. DNA Repair (Amst). 2007. PMID: 17166779
-
A vital role for Ape1/Ref1 protein in repairing spontaneous DNA damage in human cells.Mol Cell. 2005 Feb 4;17(3):463-70. doi: 10.1016/j.molcel.2004.12.029. Mol Cell. 2005. PMID: 15694346
-
Suppression of oxidative phosphorylation in mouse embryonic fibroblast cells deficient in apurinic/apyrimidinic endonuclease.DNA Repair (Amst). 2015 Mar;27:40-8. doi: 10.1016/j.dnarep.2015.01.003. Epub 2015 Jan 16. DNA Repair (Amst). 2015. PMID: 25645679 Free PMC article.
-
Nuclear complex of glyceraldehyde-3-phosphate dehydrogenase and DNA repair enzyme apurinic/apyrimidinic endonuclease I protect smooth muscle cells against oxidant-induced cell death.FASEB J. 2017 Jul;31(7):3179-3192. doi: 10.1096/fj.201601082R. Epub 2017 Apr 12. FASEB J. 2017. PMID: 28404743 Free PMC article.
-
Molecular and biological roles of Ape1 protein in mammalian base excision repair.DNA Repair (Amst). 2005 Dec 8;4(12):1442-9. doi: 10.1016/j.dnarep.2005.09.004. Epub 2005 Sep 30. DNA Repair (Amst). 2005. PMID: 16199212 Review.
Cited by
-
Mitochondrial DNA damage is associated with reduced mitochondrial bioenergetics in Huntington's disease.Free Radic Biol Med. 2012 Oct 1;53(7):1478-88. doi: 10.1016/j.freeradbiomed.2012.06.008. Epub 2012 Jun 16. Free Radic Biol Med. 2012. PMID: 22709585 Free PMC article.
-
APE1/Ref-1 facilitates recovery of gray and white matter and neurological function after mild stroke injury.Proc Natl Acad Sci U S A. 2016 Jun 21;113(25):E3558-67. doi: 10.1073/pnas.1606226113. Epub 2016 Jun 6. Proc Natl Acad Sci U S A. 2016. PMID: 27274063 Free PMC article.
-
Regulation of mouse-renin gene by apurinic/apyrimidinic-endonuclease 1 (APE1/Ref-1) via recruitment of histone deacetylase 1 corepressor complex.J Hypertens. 2012 May;30(5):917-25. doi: 10.1097/HJH.0b013e3283525124. J Hypertens. 2012. PMID: 22441348 Free PMC article.
-
Redox regulation of apurinic/apyrimidinic endonuclease 1 activity in Long-Evans Cinnamon rats during spontaneous hepatitis.Mol Cell Biochem. 2014 Mar;388(1-2):185-93. doi: 10.1007/s11010-013-1909-y. Epub 2013 Dec 15. Mol Cell Biochem. 2014. PMID: 24337968 Free PMC article.
-
Apoptosis induced by persistent single-strand breaks in mitochondrial genome: critical role of EXOG (5'-EXO/endonuclease) in their repair.J Biol Chem. 2011 Sep 16;286(37):31975-83. doi: 10.1074/jbc.M110.215715. Epub 2011 Jul 18. J Biol Chem. 2011. PMID: 21768646 Free PMC article.
References
-
- Demple, B. & Harrison, L. (1994) Annu. Rev. Biochem. 63, 915–948. - PubMed
-
- Beckman, K. B. & Ames, B. N. (1997) J. Biol. Chem. 272, 19633–19636. - PubMed
-
- Evans, A. R., Limp-Foster, M. & Kelley, M. R. (2000) Mutat. Res. 461, 83–108. - PubMed
-
- Wiederhold, L., Leppard, J. B., Kedar, P., Karimi-Busheri, F., Rasouli-Nia, A., Weinfeld, M., Tomkinson, A. E., Izumi, T., Prasad, R., Wilson, S. H., et al. (2004) Mol. Cell 15, 209–220. - PubMed
Publication types
MeSH terms
Substances
Grants and funding
LinkOut - more resources
Full Text Sources
Other Literature Sources
Molecular Biology Databases
Research Materials
Miscellaneous
