. 2005 Jul 21;24(31):4993-9.
doi: 10.1038/sj.onc.1208683.

Bik/NBK accumulation correlates with apoptosis-induction by bortezomib (PS-341, Velcade) and other proteasome inhibitors

Affiliations

Bik/NBK accumulation correlates with apoptosis-induction by bortezomib (PS-341, Velcade) and other proteasome inhibitors

Hongbo Zhu et al. Oncogene. .

Abstract

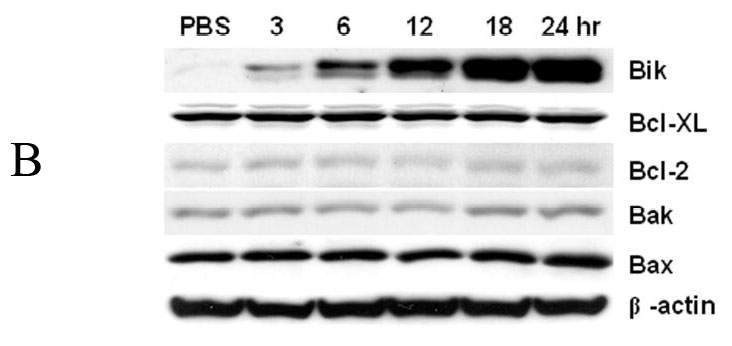
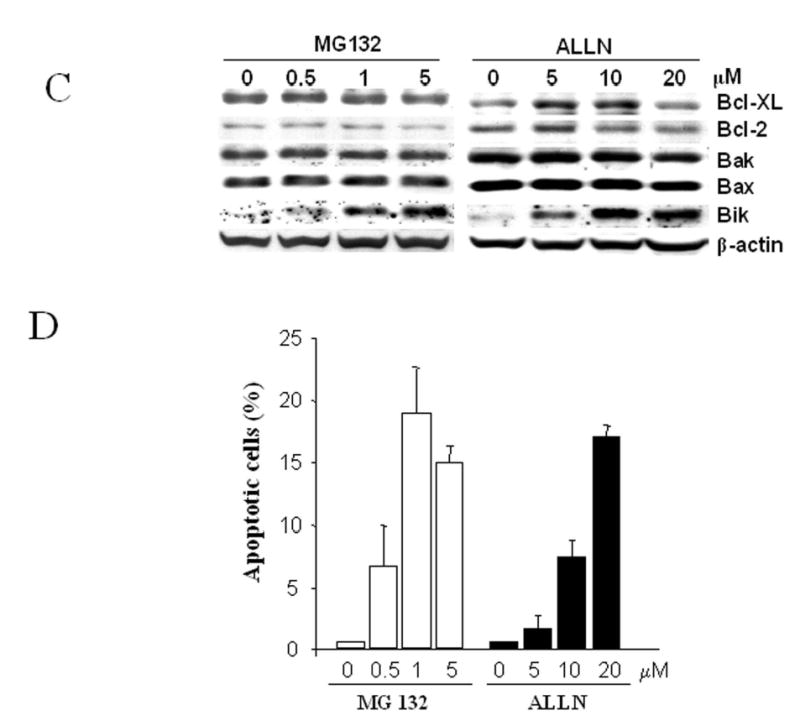
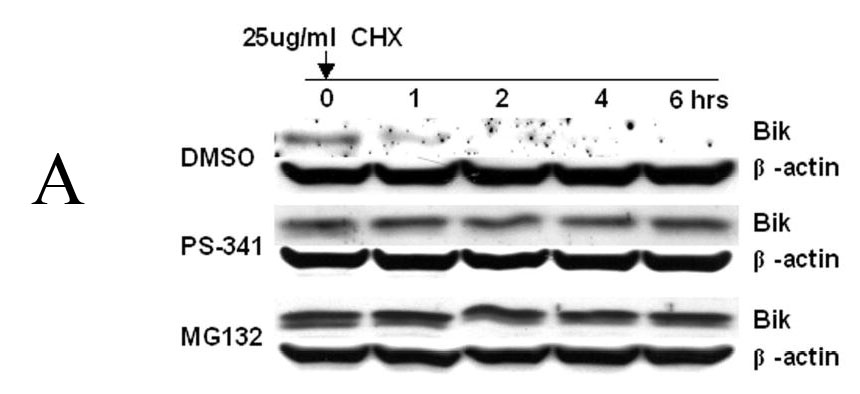
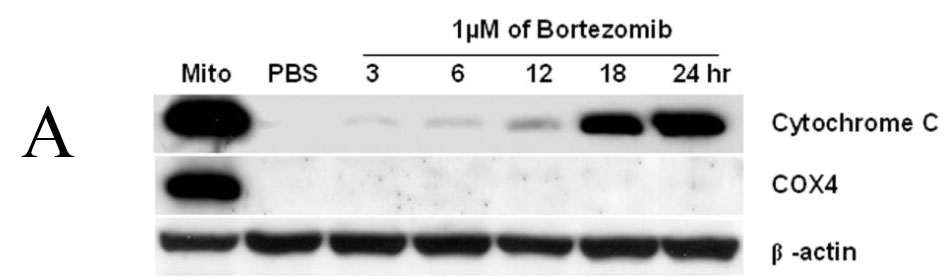
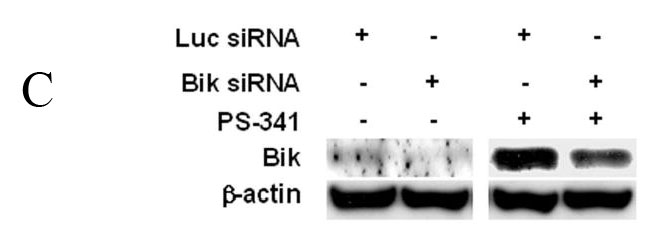
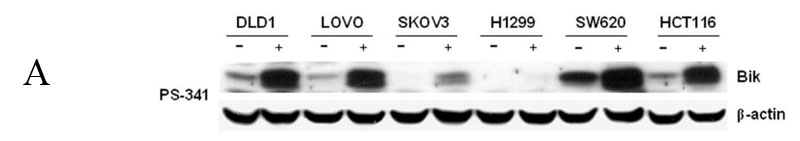
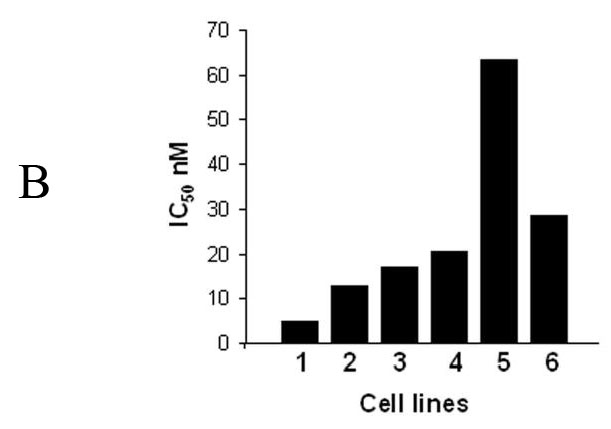
Proteasome inhibitors have emerged as promising anticancer therapeutic agents. Bortezomib (PS-341), a specific proteasome inhibitor, exhibits antitumor activity against a wide range of malignancies and has been approved by the US Food and Drug Administration for the treatment of relapsed or refractory multiple myeloma. However, the molecular mechanisms of bortezomib-mediated apoptosis remain unclear. To characterize the mechanisms of apoptosis induction by proteasome inhibitors, we examined levels of Bcl-2 protein family members (Bik/NBK, Bax, Bak, Bcl-2, and Bcl-XL), release of cytochrome c, and activation of caspase-9 and -3 in human colon cancer cell lines DLD1, LOVO, SW620, and HCT116; human lung cancer cell line H1299; and human ovarian cancer cell line SKOV3 after they were treated with bortezomib. The result showed that bortezomib induced rapid accumulation of Bik/NBK but not other Bcl-2 family members in all six cell lines. Bortezomib-mediated Bik/NBK accumulation and apoptosis were also observed in human embryonic kidney cells 293 and normal human bronchial epithelial cells. Moreover, dramatic Bik/NBK accumulation and apoptosis induction were observed when cells were treated with proteasome inhibitor MG132 and calpain inhibitor I (ALLN). Furthermore, no detectable changes in IkappaBalpha levels or in NFkappaB functionality were found after treatment with bortezomib. Finally, Bik/NBK accumulation was caused by stabilization of the protein from degradation and was associated with bortezomib cytotoxicity and apoptosis induction. Pretreatment of DLD1 cells with Bik/NBK siRNA reduced bortezomib-mediated Bik/NBK accumulation and cell death. Our results suggested that Bik/NBK is one of the mediators of proteasome inhibitor-induced apoptosis.


Figures

Fig. 1
Fig. 1
Western blot Profiles of Bcl-2 family members after treatment with bortezomib. (A) Human colon carcinoma cell lines (DLD-1, LOVO, SW620 and HCT116), human lung cancer cell H1299 and human ovarian cancer cell SKOV3 were treated with 0.1 to 5- μM bortezomib for 6 hours. (B) DLD1 cells were treated with 1 μM bortezomib for 3–24 hours. (C) Western blot analysis of DLD1 cells treated with MG132 (0.5 to 5 μM) or ALLN (5 to 20 μM) for 24 h. Data represent one of two independent experiments with similar results. (D) Apoptotic cells determined by SubG1 assay in cell samples treated as in (C). The values represent mean + SD of three assays.
Fig. 1
Fig. 1
Western blot Profiles of Bcl-2 family members after treatment with bortezomib. (A) Human colon carcinoma cell lines (DLD-1, LOVO, SW620 and HCT116), human lung cancer cell H1299 and human ovarian cancer cell SKOV3 were treated with 0.1 to 5- μM bortezomib for 6 hours. (B) DLD1 cells were treated with 1 μM bortezomib for 3–24 hours. (C) Western blot analysis of DLD1 cells treated with MG132 (0.5 to 5 μM) or ALLN (5 to 20 μM) for 24 h. Data represent one of two independent experiments with similar results. (D) Apoptotic cells determined by SubG1 assay in cell samples treated as in (C). The values represent mean + SD of three assays.
Fig. 2
Fig. 2
Western blot analysis and NFκB function assay. (A) DLD1, 293 and normal human bronchial epithelial cells (HBE) treated with 10 or 50 nM bortezomib for 24 h. (B) DLD1 cells treated with 100 nM paclitaxel or 50 nM bortezomib for various times as indicated. (C) DLD1 cells treated with 0.1 to 5 μM bortezomib for 6 hours as described in Figure 1A. (D) NFκB function detected by EMSA. DLD1 cells treated with 100 nM bortezomib for 0 to 24h or with 10 to 500 nM bortezomib for 24h. DLD1 cells treated with PBS or 20 nM TNFα were used as mock (−) or positive (+) controls. Data represent one of two independent experiments with similar results.
Fig. 2
Fig. 2
Western blot analysis and NFκB function assay. (A) DLD1, 293 and normal human bronchial epithelial cells (HBE) treated with 10 or 50 nM bortezomib for 24 h. (B) DLD1 cells treated with 100 nM paclitaxel or 50 nM bortezomib for various times as indicated. (C) DLD1 cells treated with 0.1 to 5 μM bortezomib for 6 hours as described in Figure 1A. (D) NFκB function detected by EMSA. DLD1 cells treated with 100 nM bortezomib for 0 to 24h or with 10 to 500 nM bortezomib for 24h. DLD1 cells treated with PBS or 20 nM TNFα were used as mock (−) or positive (+) controls. Data represent one of two independent experiments with similar results.
Fig. 3
Fig. 3
Effect of proteasome inhibitors on Bik/NBK degradation. (A) DLD1 cells were treated with DMSO, 1 μM bortezomib, or 5 μM MG132 for 6 hours, and then with 25 μg/ml of cycloheximide to block protein synthesis. Western blot analysis was performed. Data represent one of three independent experiments with similar results. (B) Quantitative analysis of the Western blot results shown in (A) using Optimas software. Data represent means ± SD of three assays.
Fig. 3
Fig. 3
Effect of proteasome inhibitors on Bik/NBK degradation. (A) DLD1 cells were treated with DMSO, 1 μM bortezomib, or 5 μM MG132 for 6 hours, and then with 25 μg/ml of cycloheximide to block protein synthesis. Western blot analysis was performed. Data represent one of three independent experiments with similar results. (B) Quantitative analysis of the Western blot results shown in (A) using Optimas software. Data represent means ± SD of three assays.
Fig. 4
Fig. 4
Bortezomib-induced apoptosis in DLD1 cells. (A) and (B) Apoptosis induction. Cells were treated with 1 μM bortezomib for 3–24 hours. Cell lysates were then analyzed by Western blotting. Mito, mitochondria control. Data represent one of two independent experiments with similar results. (C) Bik/NBK levels after treatment with siRNA ± bortezomib. (D) Bortezomib-mediated cell killing. Cells were pretreated with PBS, luciferase siRNA or Bik/NBK siRNA for 24 h and then treated with 1 μM bortezomib for another 24 h. Cell viability was determined in quadruplet and was normalized with cells treated with PBS alone, which was arbitrarily set as 1. Each value represents the mean +SD. * indicates p <0.01.
Fig. 4
Fig. 4
Bortezomib-induced apoptosis in DLD1 cells. (A) and (B) Apoptosis induction. Cells were treated with 1 μM bortezomib for 3–24 hours. Cell lysates were then analyzed by Western blotting. Mito, mitochondria control. Data represent one of two independent experiments with similar results. (C) Bik/NBK levels after treatment with siRNA ± bortezomib. (D) Bortezomib-mediated cell killing. Cells were pretreated with PBS, luciferase siRNA or Bik/NBK siRNA for 24 h and then treated with 1 μM bortezomib for another 24 h. Cell viability was determined in quadruplet and was normalized with cells treated with PBS alone, which was arbitrarily set as 1. Each value represents the mean +SD. * indicates p <0.01.
Fig. 5
Fig. 5
Bortezomib-induced Bik/NBK accumulation and apoptosis different cancer cell lines. (A) Bortezomib-induced Bik/NBk accumulation. Cells were treated with 1 μM bortezomib (+) for 6 hours and harvested for Western blotting. Control cells (−) received no bortezomib. Data represent one of two independent experiments with similar results. (B) IC50 determined by XTT assay at 4 days for the six cell lines listed in (A). (1) Lovo; (2) SW620; (3) HCT116; (4) DLD1; (5) SKVO3; (6) H1299.
Fig. 5
Fig. 5
Bortezomib-induced Bik/NBK accumulation and apoptosis different cancer cell lines. (A) Bortezomib-induced Bik/NBk accumulation. Cells were treated with 1 μM bortezomib (+) for 6 hours and harvested for Western blotting. Control cells (−) received no bortezomib. Data represent one of two independent experiments with similar results. (B) IC50 determined by XTT assay at 4 days for the six cell lines listed in (A). (1) Lovo; (2) SW620; (3) HCT116; (4) DLD1; (5) SKVO3; (6) H1299.

Similar articles

Cited by

References

    1. Adams J. Oncologist. 2002a;7:9–16. - PubMed
    1. Adams J. Cur Opinion Oncol. 2002b;14:628–634. - PubMed
    1. Adams J, Palombella VJ, Sausville EA, Johnson J, Destree A, Lazarus DD, Maas J, Pien CS, Prakash S, Elliott PJ. Cancer Res. 1999;59:2615–2622. - PubMed
    1. Boyd JM, Gallo GJ, Elangovan B, Houghton AB, Malstrom S, Avery BJ, Ebb RG, Subramanian T, Chittenden T, Lutz RJ, et al. Oncogene. 1995;11:1921–8. - PubMed
    1. Gillissen B, Essmann F, Graupner V, Starck L, Radetzki S, Dorken B, Schulze-Osthoff K, Daniel PT. EMBO J. 2003;22:3580–3590. - PMC - PubMed

Publication types