

Aerobic exercise, lipids and lipoproteins in overweight and obese adults: a meta-analysis of randomized controlled trials
- PMID: 15824746
- PMCID: PMC2443827
- DOI: 10.1038/sj.ijo.0802959
Aerobic exercise, lipids and lipoproteins in overweight and obese adults: a meta-analysis of randomized controlled trials
Abstract
Objective: Use the meta-analytic approach to examine the effects of aerobic exercise on lipids and lipoproteins in overweight and obese adults.
Data sources: (1) Computerized literature searches, (2) cross-referencing from review and original articles, (3) hand searching, and (4) expert review of reference list.
Study selection: (1) randomized controlled trials, (2) aerobic exercise > or =8 weeks, (3) adult humans > or =18 y of age, (4) all subjects overweight or obese (BMI > or =25 kg/m(2)), (5) studies published in journal, dissertation, or master's thesis format, (6) studies published in the English-language, (7) studies published between 1 January 1955 and 1 January 2003, (8) assessment of one or more of the following lipid and/or lipoprotein variables: total cholesterol (TC), high-density lipoprotein cholesterol (HDL), low-density lipoprotein cholesterol (LDL), and triglycerides (TG).
Data abstraction: Dual-coding by the first two authors (inter-rater agreement=0.96).
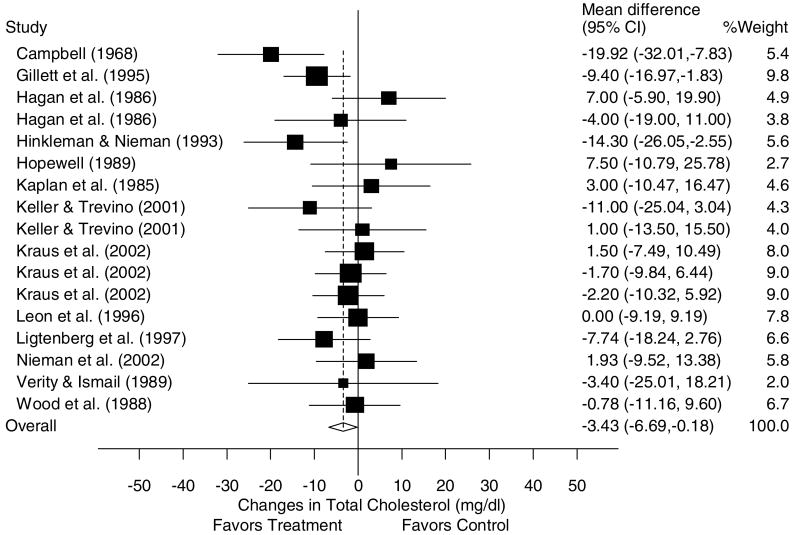
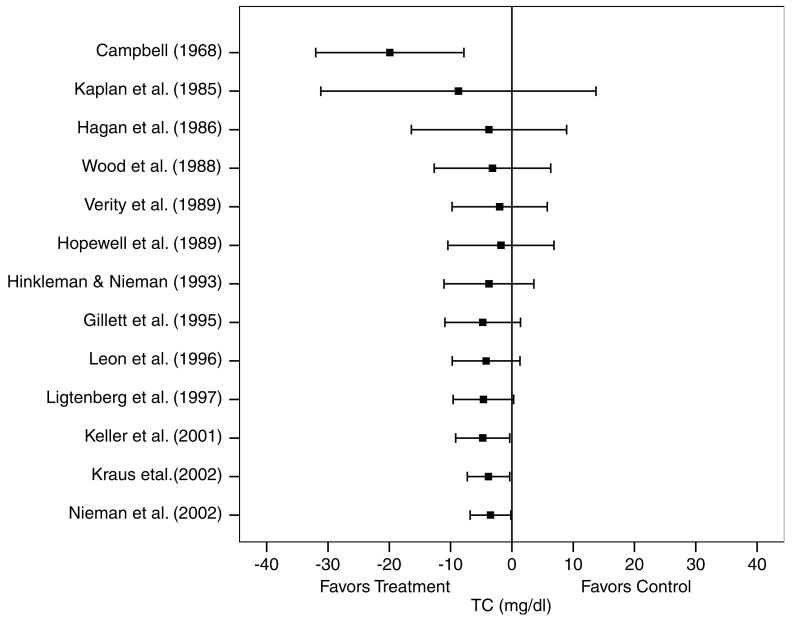
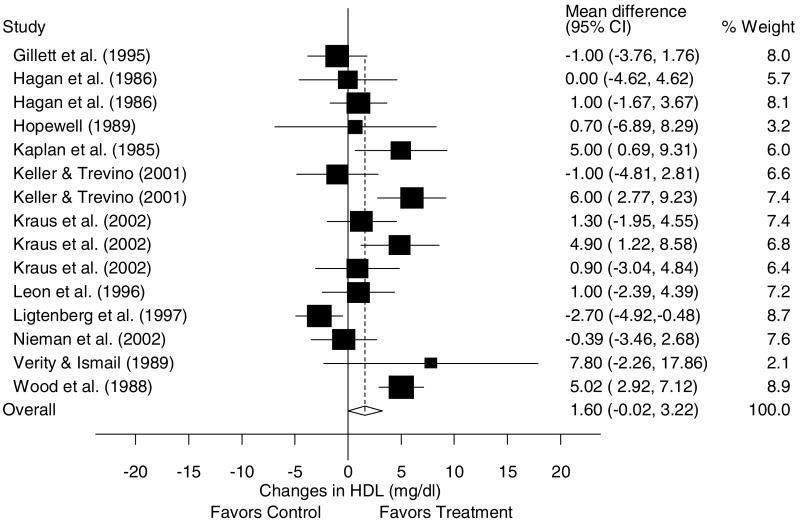
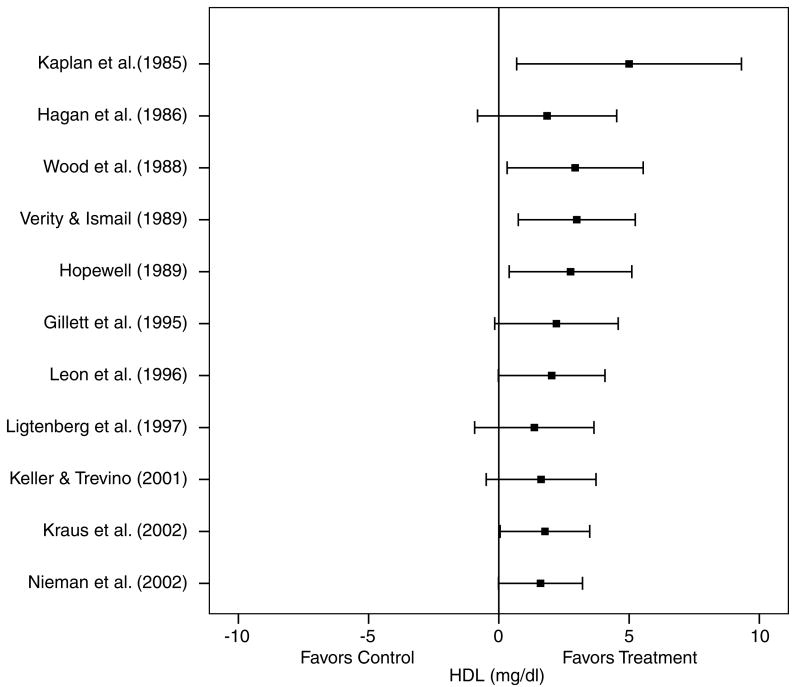
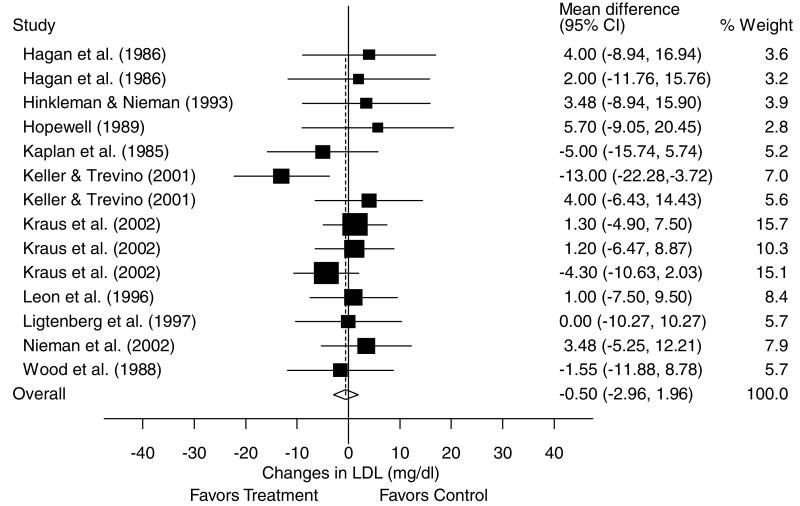
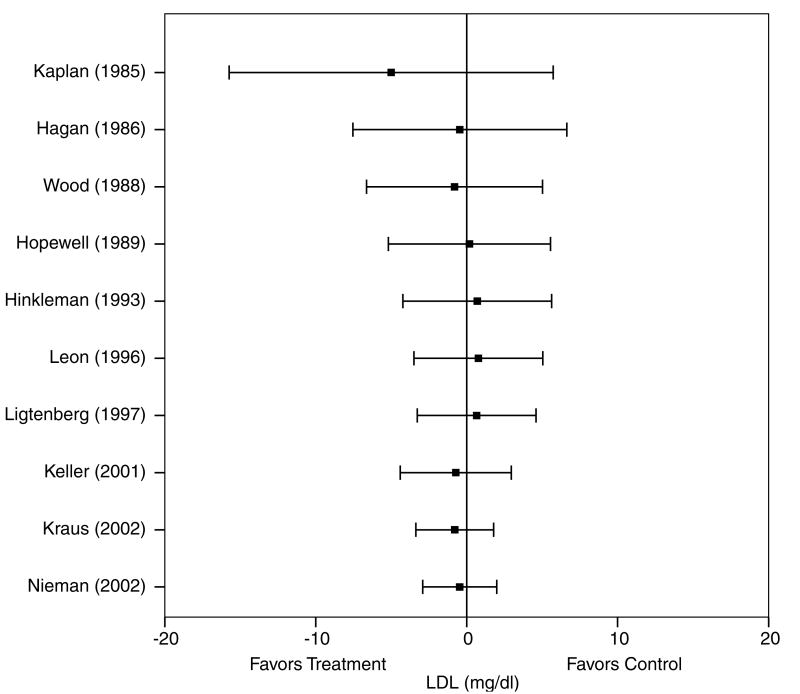
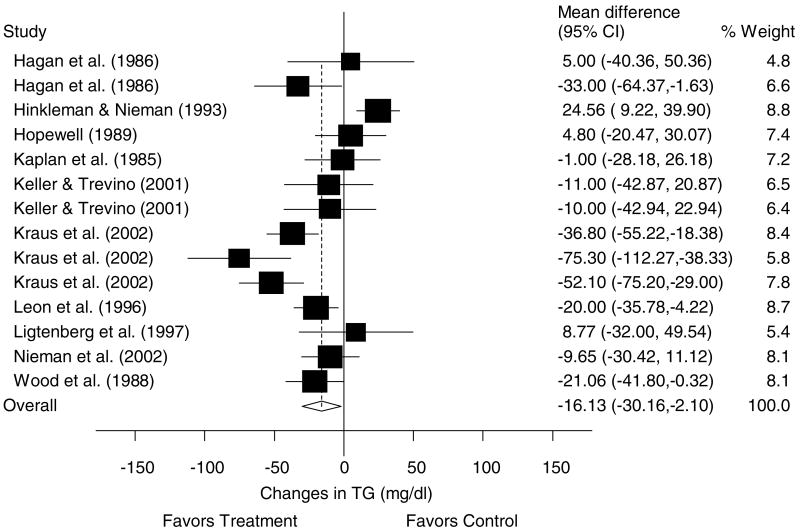
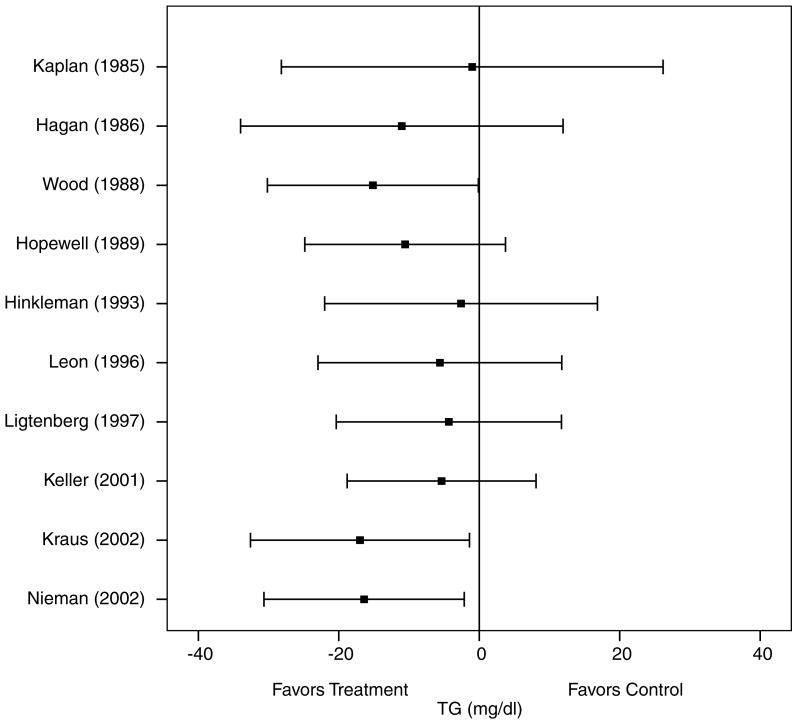
Results: In total, 13 studies representing 31 groups (17 exercise, 14 control), 613 subjects (348 exercise, 265 control), and up to 17 outcomes were available for pooling. Across all categories, random-effects modeling resulted in statistically significant improvements for TC (X +/- s.e.m., - 3.4+/-1.7 mg/dl, 95% CI, - 6.7 to - 0.2 mg/dl) and TG (X +/-s.e.m., - 16.1+/-7.3 mg/dl, 95% CI, - 30.2 to - 2.1 mg/dl) but not HDL (X +/- s.e.m., 1.6+/-0.8 mg/dl, 95% CI, - 0.02 to 3.2 mg/dl) or LDL (X +/-s.e.m., - 0.5+/-1.3 mg/dl, 95% CI, - 3.0 to 2.0 mg/dl). Changes were equivalent to improvements of 2% (TC), 11% (TG), 3% (HDL), and 0.3% (LDL). After conducting sensitivity analyses (each study deleted from the model once), only decreases in TG remained statistically significant. Increases in HDL were associated with increases in maximum oxygen consumption (VO(2 max) in ml/kg/min, r=0.75, P=0.002) and decreases in body weight (r=0.77, P<0.001), while decreases in LDL were associated with decreases in body weight (r=0.75, P=0.009).
Conclusions: Aerobic exercise decreases TG in overweight and obese adults. However, a need exists for additional randomized controlled trials in various overweight and/or obese populations above and beyond those included in our analysis.
Figures
References
-
- Flegal KM, Carroll MD, Ogden CL, Johnson CL. Prevalence and trends in obesity among US adults, 1999–2000. JAMA. 2002;288:1723–1727. - PubMed
-
- Expert Panel on Detection, Evaluation, and Treatment of High Blood Cholesterol in Adults. Executive summary of the third report of the National Cholesterol Education Program (NCEP) Expert Panel on Detection, Evaluation, and Treatment of High Blood Cholesterol in Adults (Adult Treatment Panel III) JAMA. 2001;285:2486–2497. - PubMed
-
- Campbell DE. Effect of controlled running on serum cholesterol of young adult males of varying morphological constitutions. Res Q. 1968;39:47–53. - PubMed
-
- Gillett PA, Caserta MS, White AT, Martinson L. Responses of 49- to 59-year old sedentary, overweight women to four months of exercise conditioning and/or fitness education. Activities Adaptation Aging. 1995;19:13–32.
-
- Hagan RD, Upton SJ, Wong L, Whittam J. The effects of aerobic conditioning and/or caloric restriction in overweight men and women. Med Sci Sports Exerc. 1986;18:87–94. - PubMed
Publication types
MeSH terms
Substances
Grants and funding
LinkOut - more resources
Full Text Sources
Medical
Miscellaneous
