

The neural substrates of infant sleep in rats
- PMID: 15826218
- PMCID: PMC1079781
- DOI: 10.1371/journal.pbio.0030143
The neural substrates of infant sleep in rats
Abstract
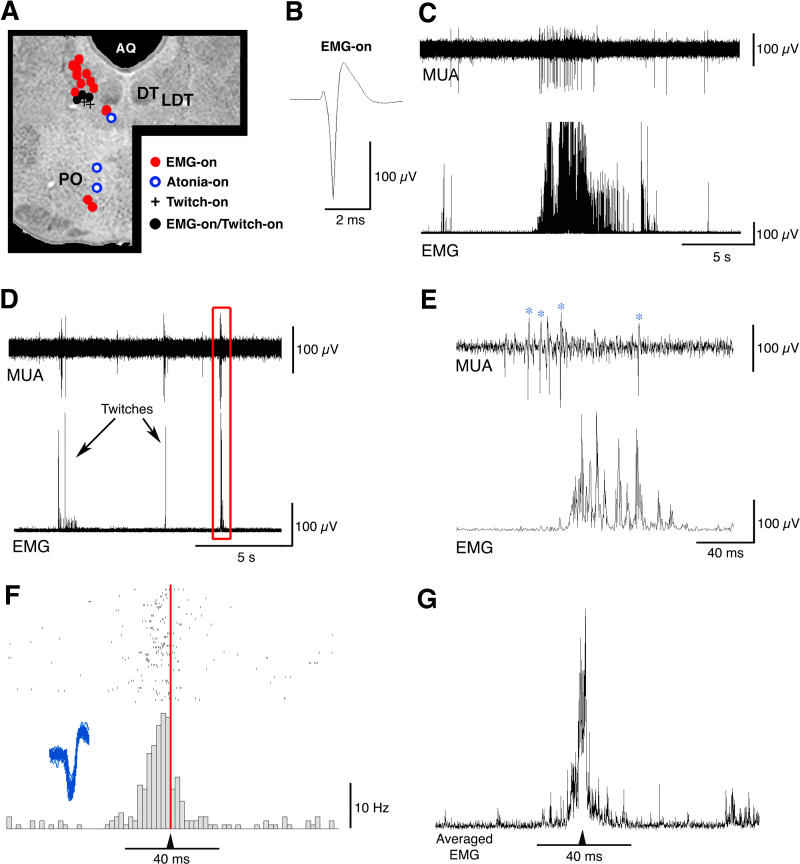
Sleep is a poorly understood behavior that predominates during infancy but is studied almost exclusively in adults. One perceived impediment to investigations of sleep early in ontogeny is the absence of state-dependent neocortical activity. Nonetheless, in infant rats, sleep is reliably characterized by the presence of tonic (i.e., muscle atonia) and phasic (i.e., myoclonic twitching) components; the neural circuitry underlying these components, however, is unknown. Recently, we described a medullary inhibitory area (MIA) in week-old rats that is necessary but not sufficient for the normal expression of atonia. Here we report that the infant MIA receives projections from areas containing neurons that exhibit state-dependent activity. Specifically, neurons within these areas, including the subcoeruleus (SubLC), pontis oralis (PO), and dorsolateral pontine tegmentum (DLPT), exhibit discharge profiles that suggest causal roles in the modulation of muscle tone and the production of myoclonic twitches. Indeed, lesions in the SubLC and PO decreased the expression of muscle atonia without affecting twitching (resulting in "REM sleep without atonia"), whereas lesions of the DLPT increased the expression of atonia while decreasing the amount of twitching. Thus, the neural substrates of infant sleep are strikingly similar to those of adults, a surprising finding in light of theories that discount the contribution of supraspinal neural elements to sleep before the onset of state-dependent neocortical activity.
Figures


Similar articles
-
Active medullary control of atonia in week-old rats.Neuroscience. 2005;130(1):275-83. doi: 10.1016/j.neuroscience.2004.09.002. Neuroscience. 2005. PMID: 15561443 Free PMC article.
-
Medullary circuitry regulating rapid eye movement sleep and motor atonia.J Neurosci. 2009 Jul 22;29(29):9361-9. doi: 10.1523/JNEUROSCI.0737-09.2009. J Neurosci. 2009. PMID: 19625526 Free PMC article.
-
Movement suppression during anesthesia: neural projections from the mesopontine tegmentum to areas involved in motor control.J Comp Neurol. 2005 Sep 5;489(4):425-48. doi: 10.1002/cne.20636. J Comp Neurol. 2005. PMID: 16025457
-
[Selective stimulations and lesions of the rat brain nuclei as the models for research of the human sleep pathology mechanisms].Glas Srp Akad Nauka Med. 2011;(51):85-97. Glas Srp Akad Nauka Med. 2011. PMID: 22165729 Review. Serbian.
-
The atonia and myoclonia of active (REM) sleep.Annu Rev Psychol. 1990;41:557-84. doi: 10.1146/annurev.ps.41.020190.003013. Annu Rev Psychol. 1990. PMID: 1968326 Review.
Cited by
-
From spontaneous motor activity to coordinated behaviour: a developmental model.PLoS Comput Biol. 2014 Jul 24;10(7):e1003653. doi: 10.1371/journal.pcbi.1003653. eCollection 2014 Jul. PLoS Comput Biol. 2014. PMID: 25057775 Free PMC article.
-
Evidence for Electrical Coupling in the SubCoeruleus (SubC) Nucleus.J Neurophysiol. 2007 Apr;97(4):3142-7. doi: 10.1152/jn.01316.2006. Epub 2007 Jan 10. J Neurophysiol. 2007. PMID: 17215497 Free PMC article.
-
Brainstem and hypothalamic regulation of sleep pressure and rebound in newborn rats.Behav Neurosci. 2010 Feb;124(1):69-78. doi: 10.1037/a0018100. Behav Neurosci. 2010. PMID: 20141281 Free PMC article.
-
Neonatal brainstem dysfunction risks infant social engagement.Soc Cogn Affect Neurosci. 2013 Feb;8(2):158-64. doi: 10.1093/scan/nsr082. Epub 2011 Dec 5. Soc Cogn Affect Neurosci. 2013. PMID: 22146141 Free PMC article.
-
Circadian clocks, rhythmic synaptic plasticity and the sleep-wake cycle in zebrafish.Front Neural Circuits. 2013 Feb 1;7:9. doi: 10.3389/fncir.2013.00009. eCollection 2013. Front Neural Circuits. 2013. PMID: 23378829 Free PMC article. Review.
References
-
- Frank MG, Heller HC. Development of REM and slow wave sleep in the rat. Am J Physiol. 1997;272:R1792–R1799. - PubMed
-
- Gramsbergen A. The development of the EEG in the rat. Dev Psychobiol. 1976;9:501–515. - PubMed
-
- Mirmiran M, Corner M. Neuronal discharge patterns in the occipital cortex of developing rats during active and quiet sleep. Brain Res. 1982;255:37–48. - PubMed
-
- Karlsson KÆ, Blumberg MS. The union of the state: Myoclonic twitching is coupled with nuchal muscle atonia in infant rats. Behav Neurosci. 2002;116:912–917. - PubMed
-
- Corner MA. Sleep and the beginnings of behavior in the animal kingdom—Studies of ultradian motility cycles in early life. Prog Neurobiol. 1977;8:279–295. - PubMed
Publication types
MeSH terms
Grants and funding
LinkOut - more resources
Full Text Sources
Medical
