

Statistical Viewer: a tool to upload and integrate linkage and association data as plots displayed within the Ensembl genome browser
- PMID: 15826305
- PMCID: PMC1087836
- DOI: 10.1186/1471-2105-6-95
Statistical Viewer: a tool to upload and integrate linkage and association data as plots displayed within the Ensembl genome browser
Abstract
Background: To facilitate efficient selection and the prioritization of candidate complex disease susceptibility genes for association analysis, increasingly comprehensive annotation tools are essential to integrate, visualize and analyze vast quantities of disparate data generated by genomic screens, public human genome sequence annotation and ancillary biological databases. We have developed a plug-in package for Ensembl called "Statistical Viewer" that facilitates the analysis of genomic features and annotation in the regions of interest defined by linkage analysis.
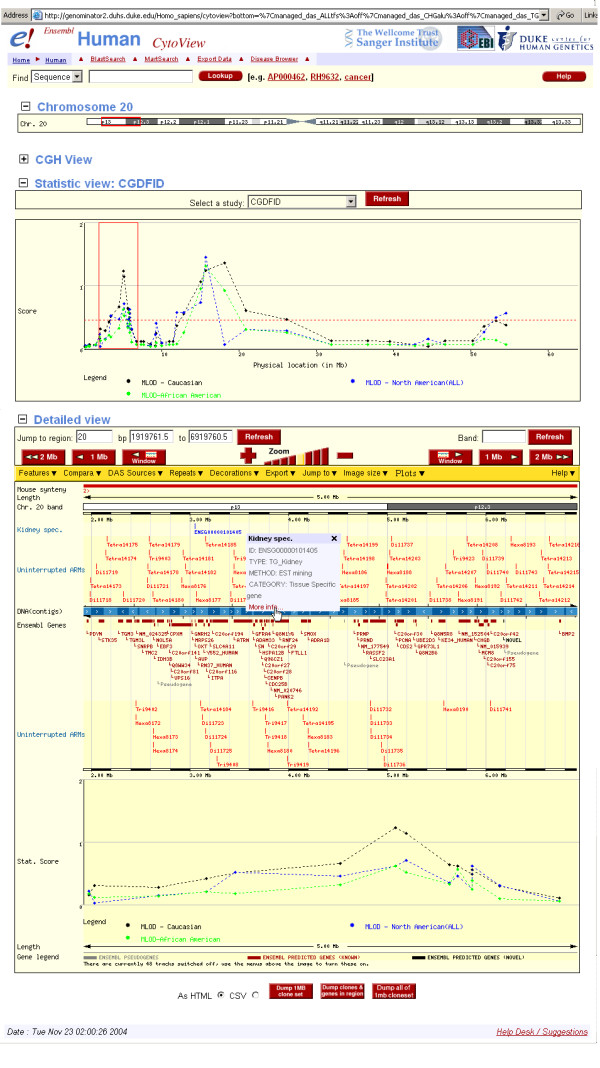
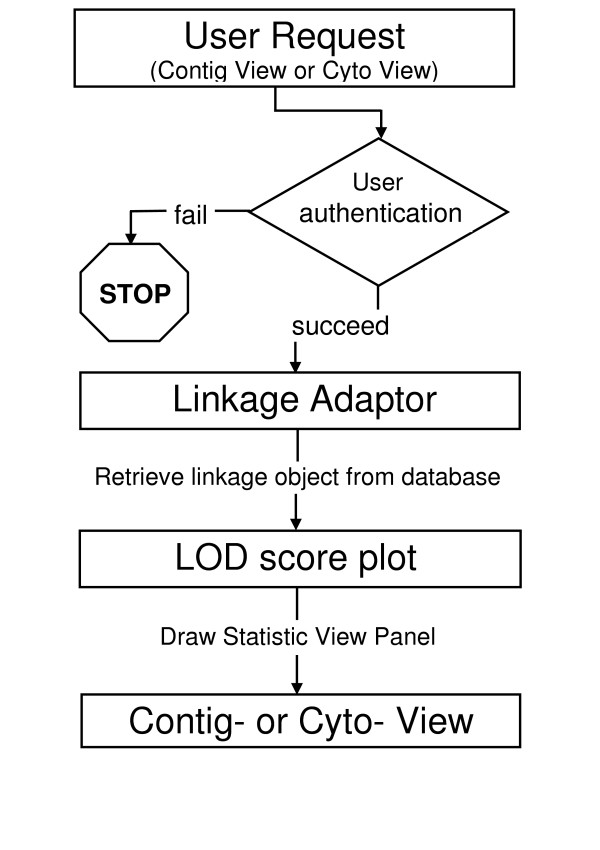
Results: Statistical Viewer is an add-on package to the open-source Ensembl Genome Browser and Annotation System that displays disease study-specific linkage and/or association data as 2 dimensional plots in new panels in the context of Ensembl's Contig View and Cyto View pages. An enhanced upload server facilitates the upload of statistical data, as well as additional feature annotation to be displayed in DAS tracts, in the form of Excel Files. The Statistical View panel, drawn directly under the ideogram, illustrates lod score values for markers from a study of interest that are plotted against their position in base pairs. A module called "Get Map" easily converts the genetic locations of markers to genomic coordinates. The graph is placed under the corresponding ideogram features a synchronized vertical sliding selection box that is seamlessly integrated into Ensembl's Contig- and Cyto- View pages to choose the region to be displayed in Ensembl's "Overview" and "Detailed View" panels. To resolve Association and Fine mapping data plots, a "Detailed Statistic View" plot corresponding to the "Detailed View" may be displayed underneath.
Conclusion: Features mapping to regions of linkage are accentuated when Statistic View is used in conjunction with the Distributed Annotation System (DAS) to display supplemental laboratory information such as differentially expressed disease genes in private data tracks. Statistic View is a novel and powerful visual feature that enhances Ensembl's utility as valuable resource for integrative genomic-based approaches to the identification of candidate disease susceptibility genes. At present there are no other tools that provide for the visualization of 2-dimensional plots of quantitative data scores against genomic coordinates in the context of a primary public genome annotation browser.
Figures


References
-
- Ashburner M, Ball CA, Blake JA, Botstein D, Butler H, Cherry JM, Davis AP, Dolinski K, Dwight SS, Eppig JT, Harris MA, Hill DP, Issel-Tarver L, Kasarskis A, Lewis S, Matese JC, Richardson JE, Ringwald M, Rubin GM, Sherlock G. Geneontology: tool for the unification of biology. The Gene Ontology Consortium. Nat Genet. 2000;25:25–29. doi: 10.1038/75556. - DOI - PMC - PubMed
-
- Hubbard T. Biological information: making it accessible and integrated (and trying to make sense of it) Bioinformatics. 2002;18:S140. - PubMed
-
- Heumann K, Harris C, Mewes HW. A top-down approach to whole genome visualization. Proc Int Conf Intell Syst Mol Biol. 1996;4:98–108. - PubMed
Publication types
MeSH terms
Grants and funding
- K22 ES000372/ES/NIEHS NIH HHS/United States
- R01AG19757-01/AG/NIA NIH HHS/United States
- ES11375/ES/NIEHS NIH HHS/United States
- U19 ES011375/ES/NIEHS NIH HHS/United States
- P50 NS39764-04S1/NS/NINDS NIH HHS/United States
- P01 NS026630/NS/NINDS NIH HHS/United States
- P01 NS26630-15/NS/NINDS NIH HHS/United States
- P50 NS039764/NS/NINDS NIH HHS/United States
- P01 HL073042/HL/NHLBI NIH HHS/United States
- R01 NS036768/NS/NINDS NIH HHS/United States
- R01 NS36768-07/NS/NINDS NIH HHS/United States
- P01 HL73042-01/HL/NHLBI NIH HHS/United States
- R01 AG021547/AG/NIA NIH HHS/United States
- R01 AG019757/AG/NIA NIH HHS/United States
- P50 NS39764-04/NS/NINDS NIH HHS/United States
- K-22 ES00372/ES/NIEHS NIH HHS/United States
LinkOut - more resources
Full Text Sources
Other Literature Sources
