

Rapid in vitro assembly dynamics and subunit turnover of FtsZ demonstrated by fluorescence resonance energy transfer
- PMID: 15826938
- PMCID: PMC2649879
- DOI: 10.1074/jbc.M500895200
Rapid in vitro assembly dynamics and subunit turnover of FtsZ demonstrated by fluorescence resonance energy transfer
Abstract
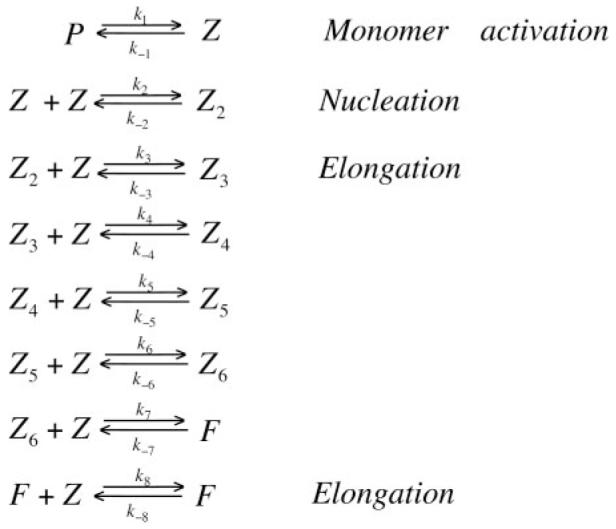
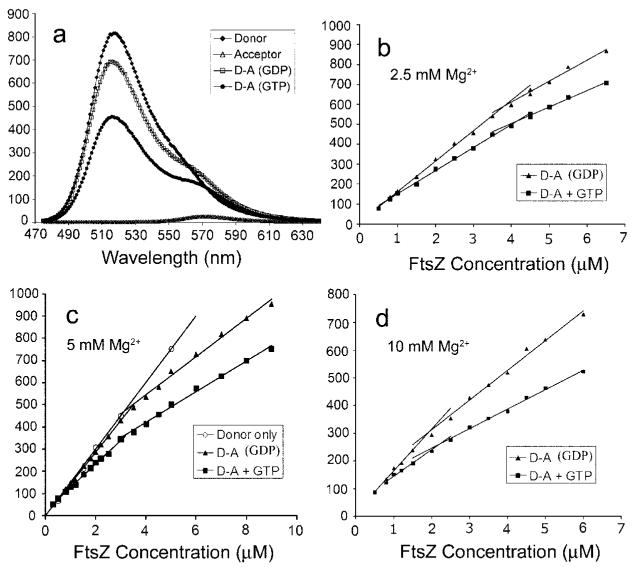
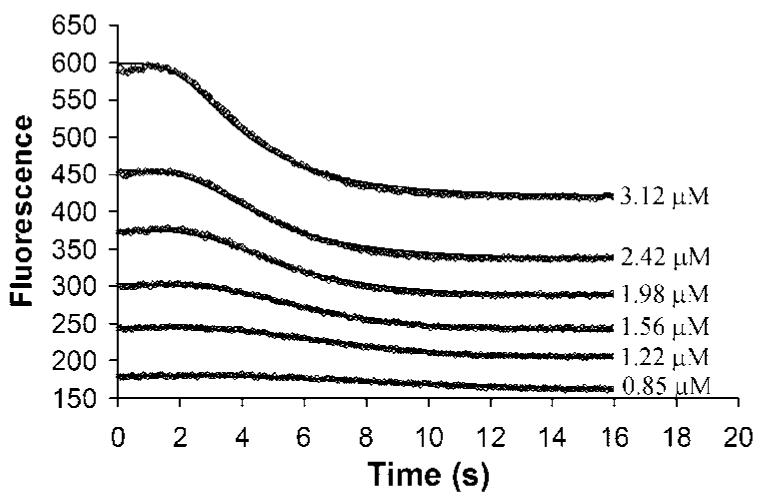
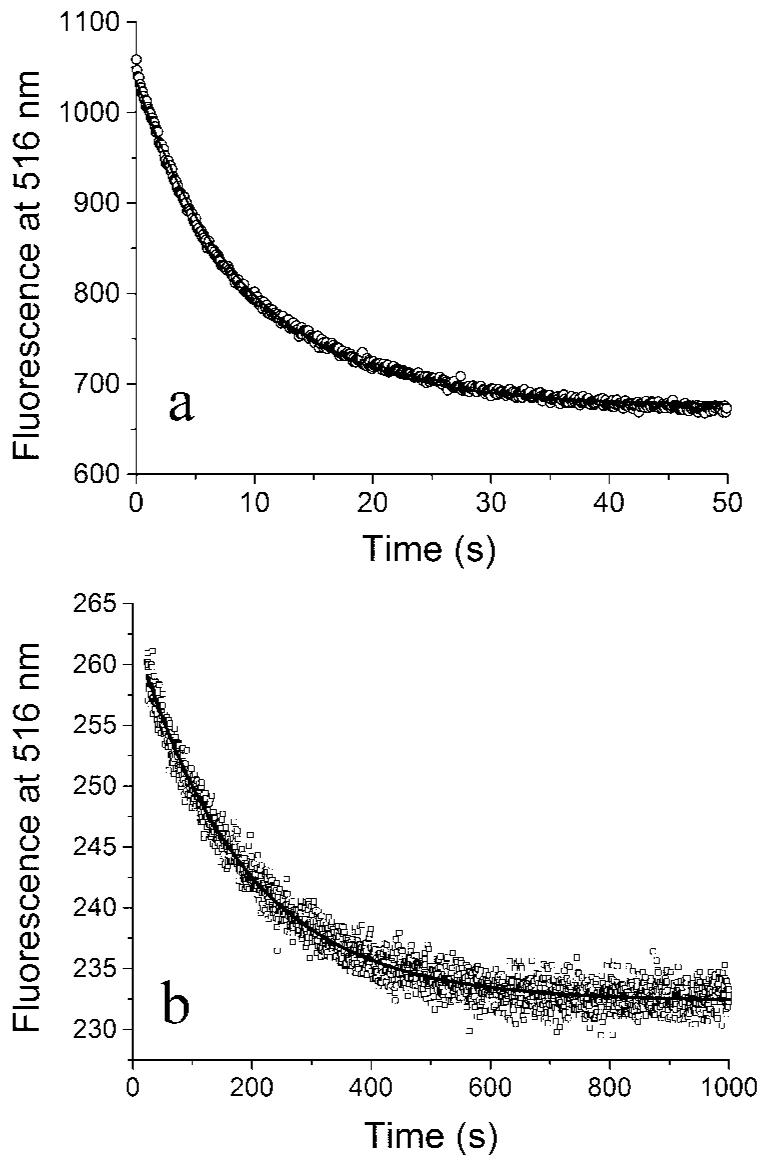
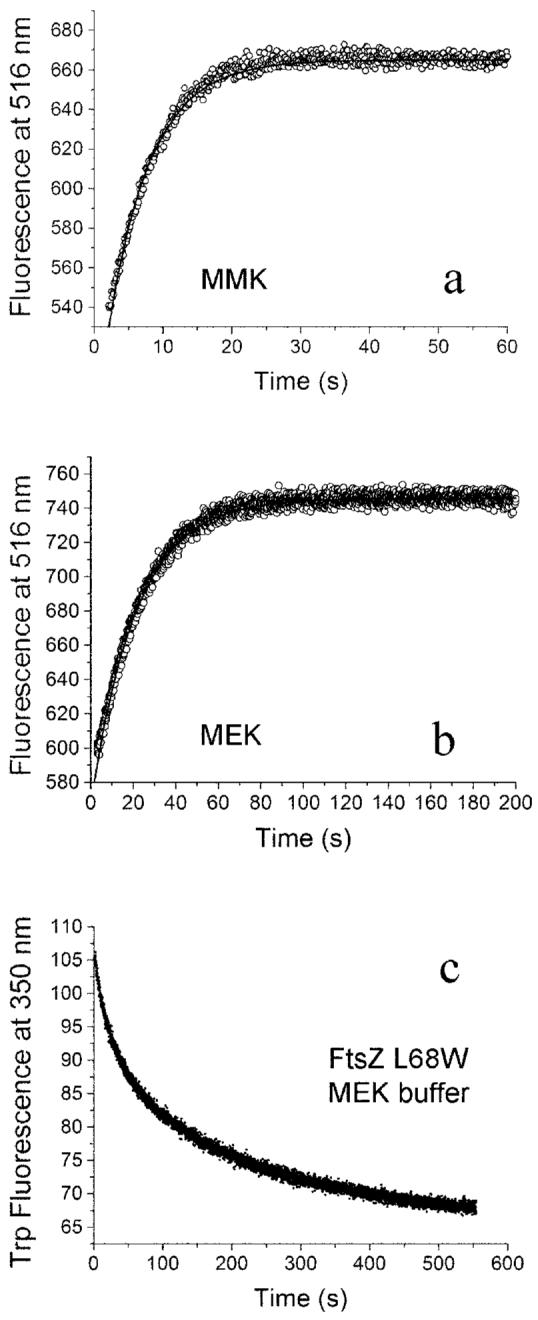
We have developed an assay for the assembly of FtsZ based on fluorescence resonance energy transfer (FRET). We mutated an innocuous surface residue to cysteine and labeled separate pools with fluorescein (donor) and tetramethylrhodamine (acceptor). When the pools were mixed and GTP was added, assembly produced a FRET signal that was linearly proportional to FtsZ concentration from 0.7 microm (the critical concentration (C(c))) to 3 microm. At concentrations greater than 3 microm, an enhanced FRET signal was observed with both GTP and GDP, indicating additional assembly above this second C(c). This second C(c) varied with Mg(2+) concentration, whereas the 0.7 microm C(c) did not. We used the FRET assay to measure the kinetics of initial assembly by stopped flow. The data were fit by the simple kinetic model used previously: monomer activation, a weak dimer nucleus, and elongation, although with some differences in kinetic parameters from the L68W mutant. We then studied the rate of turnover at steady state by pre-assembling separate pools of donor and acceptor protofilaments. When the pools were mixed, a FRET signal developed with a half-time of 7 s, demonstrating a rapid and continuous disassembly and reassembly of protofilaments at steady state. This is comparable with the 9-s half-time for FtsZ turnover in vivo and the 8-s turnover time of GTP hydrolysis in vitro. Finally, we found that an excess of GDP caused disassembly of protofilaments with a half-time of 5 s. Our new data suggest that GDP does not exchange into intact protofilaments. Rather, our interpretation is that subunits are released following GTP hydrolysis, and then they exchange GDP for GTP and reassemble into new protofilaments, all on a time scale of 7 s. The mechanism may be related to the dynamic instability of microtubules.
Figures
References
-
- Corbalan-Garcia S, Teruel JA, Gomez-Fernandez JC. Eur. J. Biochem. 1993;217:737–744. - PubMed
Publication types
MeSH terms
Substances
Grants and funding
LinkOut - more resources
Full Text Sources
