

Rates of intron loss and gain: implications for early eukaryotic evolution
- PMID: 15827119
- PMCID: PMC556292
- DOI: 10.1073/pnas.0500383102
Rates of intron loss and gain: implications for early eukaryotic evolution
Abstract
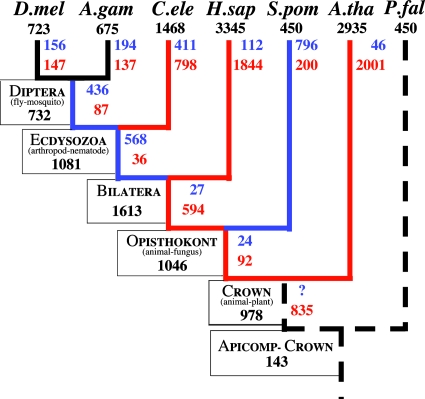
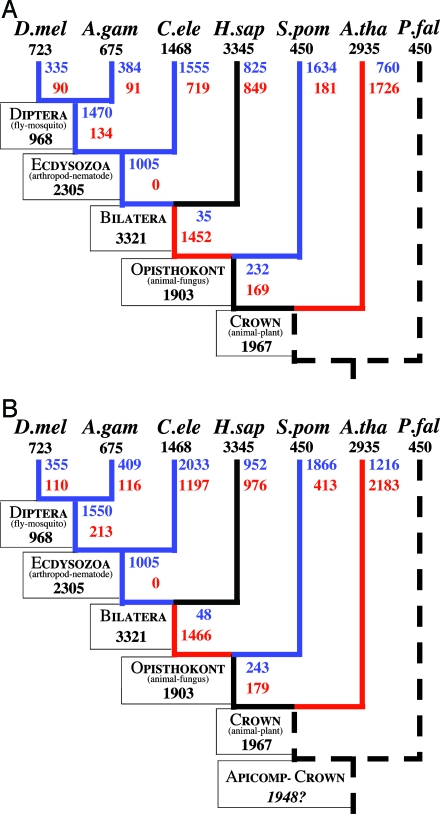
We study the intron-exon structures of 684 groups of orthologs from seven diverse eukaryotic genomes and provide maximum likelihood estimates for rates and numbers of intron losses and gains in these same genes for a variety of lineages. Rates of intron loss vary from approximately 2 x 10(-9) to 2 x 10(-10) per year. Rates of gain vary from 6 x 10(-13) to 4 x 10(-12) per possible intron insertion site per year. There is an inverse correspondence between rates of intron loss and gain, leading to a 20-fold variation among lineages in the ratio of the rates of the two processes. The observed rates of intron gain are insufficient to explain the large number of introns estimated to have been present in the plant-animal ancestor, suggesting that introns present in early eukaryotes may have been created by a fundamentally different process than more recently gained introns.
Figures
References
-
- Perler, F., Efstratiadis, A., Lomedico, P., Gilbert, W., Kolodner, R. & Dodgson, J. (1980) Cell 20 555–556. - PubMed
-
- Cavalier-Smith, T. (1985) Nature 315 283–284. - PubMed
-
- Palmer, J. D. & Logsdon, J. M., Jr. (1991) Curr. Opin. Genet. Dev. 1 470–477. - PubMed
-
- Cavalier-Smith, T. (1991) Trends Genet. 7 145–148. - PubMed
MeSH terms
LinkOut - more resources
Full Text Sources
