. 2005 Apr 19;102(16):5814-9.
doi: 10.1073/pnas.0402870102. Epub 2005 Apr 12.

Gene expression profiling reveals molecularly and clinically distinct subtypes of glioblastoma multiforme

Affiliations

Gene expression profiling reveals molecularly and clinically distinct subtypes of glioblastoma multiforme

Yu Liang et al. Proc Natl Acad Sci U S A. .

Abstract

Glioblastoma multiforme (GBM) is the most common form of malignant glioma, characterized by genetic instability, intratumoral histopathological variability, and unpredictable clinical behavior. We investigated global gene expression in surgical samples of brain tumors. Gene expression profiling revealed large differences between normal brain samples and tumor tissues and between GBMs and lower-grade oligodendroglial tumors. Extensive differences in gene expression were found among GBMs, particularly in genes involved in angiogenesis, immune cell infiltration, and extracellular matrix remodeling. We found that the gene expression patterns in paired specimens from the same GBM invariably were more closely related to each other than to any other tumor, even when the paired specimens had strikingly divergent histologies. Survival analyses revealed a set of approximately 70 genes more highly expressed in rapidly progressing tumors that stratified GBMs into two groups that differed by >4-fold in median duration of survival. We further investigated one gene from the group, FABP7, and confirmed its association with survival in two unrelated cohorts totaling 105 patients. Expression of FABP7 enhanced the motility of glioma-derived cells in vitro. Our analyses thus identify and validate a prognostic marker of both biologic and clinical significance and provide a series of putative markers for additional evaluation.


Figures

Fig. 1.
Fig. 1.
Gene expression in normal and malignant brain samples. (A) Unsupervised hierarchical clustering of 38 samples including GBMs, OACs, ODGs, and normal brain specimens. Array elements that varied at least 2-fold from the median on at least five microarrays were included (2,490 cDNA elements representing ≈2,000 genes). Samples from different regions of the same tumor are indicated by brackets. (B) Unsupervised hierarchical clustering of 32 samples including GBMs and normal brain. Array elements that varied at least 2-fold from the median on at least five microarrays were included (2,188 cDNA elements representing ≈1,800 genes). The data are displayed as a hierarchical cluster where rows represent genes (unique cDNA elements), and columns represent samples. Colored pixels capture the magnitude of the response for any gene, where shades of red and green represent induction and repression, respectively, relative to the median for each gene. Black pixels reflect no change from the median, and gray pixels represent missing data. Groups of genes with common functional or biological themes are indicated. A searchable version of this cluster is available upon request to the corresponding author.
Fig. 2.
Fig. 2.
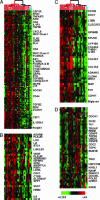
Expanded view of biologically distinct expression signatures among GBMs. Data were extracted from Fig. 1B and are displayed. Individual clusters depict genes associated with immune cells (A), hypoxia (B), ECM (C), and cellular proliferation (D). Many of the array elements encode uncharacterized genes, and only a subset of named genes is shown.
Fig. 3.
Fig. 3.
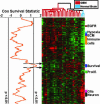
Coregulated genes that correlate with patient survival. The Cox survival statistic was calculated for every gene by using the 20 GBMs for which we could obtain survival data. Genes correlating with poorer prognosis received positive Cox scores, whereas genes correlating with better prognosis received negative Cox scores. A moving average (window size, 71 elements) of these scores was plotted adjacent to the gene expression map from Fig. 1B. A permutation-based algorithm was used to calculate moving average scores that were significant at P < 0.01, and these are indicated by vertical lines.
Fig. 4.
Fig. 4.
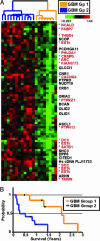
Expression of survival-associated genes stratifies GBMs into two distinct subgroups. (A) Expanded view of the survival-associated expression signature identified in Fig. 3 among 20 GBMs with survival data. The tumors are classified as belonging to Group 1 (orange) or Group 2 (blue) based on the array dendrogram. Genes marked with asterisks were among 500 genes with the top “intrinsic” scores (see text). (B) Kaplan–Meier analysis of the two subgroups indicates they have significantly different median survivals.
Fig. 5.
Fig. 5.
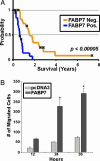
FABP7 protein expression is associated with survival in independent cohorts of GBM patients and enhances glioma cell motility in vitro. (A) Kaplan–Meier analysis of nuclear FABP7 expression in an independent cohort of 44 GBM patients. FABP7 immunoreactivity (orange for score 0, blue for score of 1 or 2) is correlated with survival (P < 0.00005). (B) SF767MG cells were transfected and plated in the upper chamber of a transwell system (see text). Results represent average number of migrated cells from three separate transfections. Error bars represent standard error of the mean. *, P < 0.001.

References

    1. Lacroix, M., Abi-Said, D., Fourney, D. R., Gokaslan, Z. L., Shi, W., DeMonte, F., Lang, F. F., McCutcheon, I. E., Hassenbusch, S. J., Holland, E., et al. (2001) J. Neurosurg. 95, 190–198. - PubMed
    1. Kleihues, P., Louis, D. N., Scheithauer, B. W., Rorke, L. B., Reifenberger, G., Burger, P. C. & Cavenee, W. K. (2002) J. Neuropathol. Exp. Neurol. 61, 215–225; discussion 226–229. - PubMed
    1. Nagane, M., Huang, H. J. & Cavenee, W. K. (1997) Curr. Opin. Oncol. 9, 215–222. - PubMed
    1. Alizadeh, A. A., Eisen, M. B., Davis, R. E., Ma, C., Lossos, I. S., Rosenwald, A., Boldrick, J. C., Sabet, H., Tran, T., Yu, X., et al. (2000) Nature 403, 503–511. - PubMed
    1. Perou, C. M., Sorlie, T., Eisen, M. B., van de Rijn, M., Jeffrey, S. S., Rees, C. A., Pollack, J. R., Ross, D. T., Johnsen, H., Akslen, L. A., et al. (2000) Nature 406, 747–752. - PubMed

Publication types

MeSH terms