Comparative Study
. 2005 May;79(9):5762-73.
doi: 10.1128/JVI.79.9.5762-5773.2005.

Binding and transfer of human immunodeficiency virus by DC-SIGN+ cells in human rectal mucosa

Affiliations
Comparative Study

Binding and transfer of human immunodeficiency virus by DC-SIGN+ cells in human rectal mucosa

Kevin B Gurney et al. J Virol. 2005 May.

Abstract

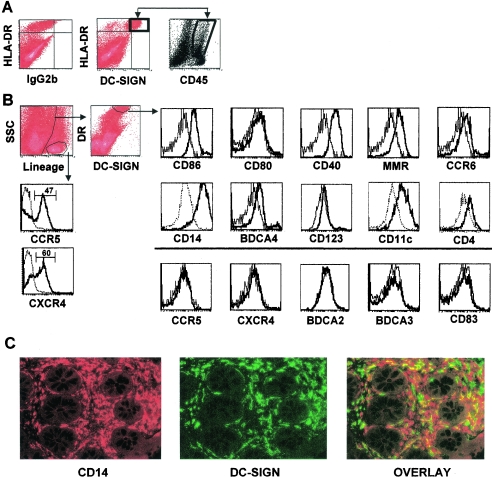
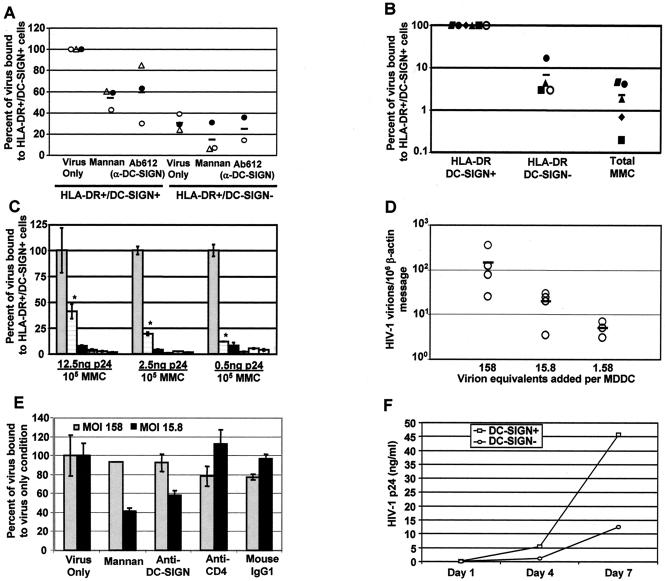
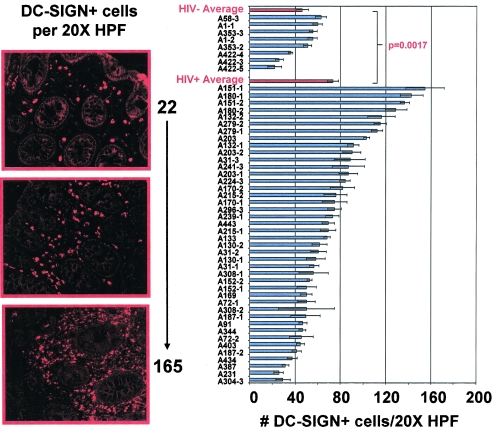
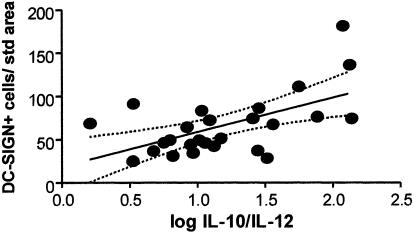
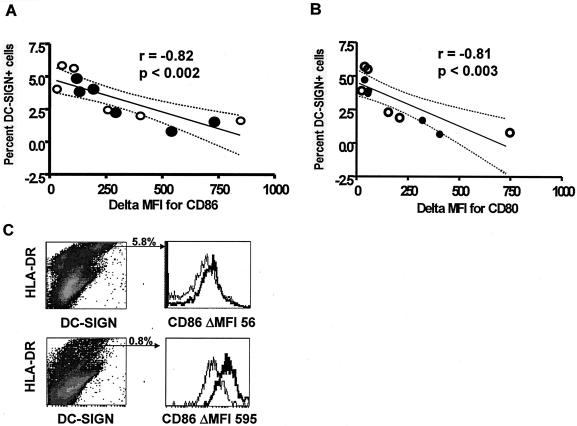
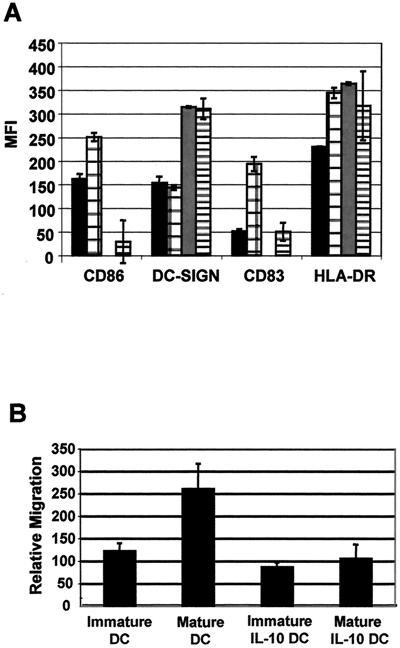
The role of DC-SIGN on human rectal mucosal dendritic cells is unknown. Using highly purified human rectal mucosal DC-SIGN+ cells and an ultrasensitive real-time reverse transcription-PCR assay to quantify virus binding, we found that HLA-DR+/DC-SIGN+ cells can bind and transfer more virus than the HLA-DR+/DC-SIGN- cells. Greater than 90% of the virus bound to total mucosal mononuclear cells (MMCs) was accounted for by the DC-SIGN+ cells, which comprise only 1 to 5% of total MMCs. Significantly, anti-DC-SIGN antibodies blocked 90% of the virus binding when more-physiologic amounts of virus inoculum were used. DC-SIGN expression in the rectal mucosa was significantly correlated with the interleukin-10 (IL-10)/IL-12 ratio (r = 0.58, P < 0.002; n = 26) among human immunodeficiency virus (HIV)-positive patients. Ex vivo and in vitro data implicate the role of IL-10 in upregulating DC-SIGN expression and downregulating expression of the costimulatory molecules CD80/CD86. Dendritic cells derived from monocytes (MDDCs) in the presence of IL-10 render the MDDCs less responsive to maturation stimuli, such as lipopolysaccharide and tumor necrosis factor alpha, and migration to the CCR7 ligand macrophage inflammatory protein 3beta. Thus, an increased IL-10 environment could render DC-SIGN(+) cells less immunostimulatory and migratory, thereby dampening an effective immune response. DC-SIGN and the IL-10/IL-12 axis may play significant roles in the mucosal transmission and pathogenesis of HIV type 1.


Figures

FIG. 1.
FIG. 1.
Phenotype of DC-SIGN+ cells in the gut mucosa. (A) The rectal MMC suspension was stained with HLA-DR-FITC, IgG2b-PE, and CD45-PerCP or HLA-DR-FITC, DC-SIGN-PE, and CD45-PerCP. A gate was drawn on the HLA-DR+/DC-SIGN+ cells based on the isotype control. Total mucosal cells were displayed based on CD45 and side scatter (SSC), with another gate drawn on where the HLA-DR+/DC-SIGN+ cells lie to show its large granularity and association with the hematopoietic cell (CD45) population (arrows). (B) MMCs from three HIV+ and three HIV individuals were stained with a lineage cocktail (CD19-APC, CD3-APC, and CD56-APC), HLA-DR-TC, DC-SIGN antibody (clone 28) conjugated with Alexa Fluor 488 using the Zenon mouse IgG2a labeling kit, and the various phenotypic markers were PE labeled as indicated. Select histograms from either HIV+ or HIV patients were drawn based on gating the lineage-negative, HLA-DR+, DC-SIGN+ cells, and each phenotypic marker (thick line) was overlaid against the isotype-matched control antibody (thin line). Histogram plots below the thick line show the markers undetectable on the DC-SIGN+ cells. DC-SIGN+ cells didn't express langerin (data not shown). The two histograms on the left were drawn based on the lineage-positive gate to show detectable CCR5 (47% positive) and CXCR4 (60% positive) expression in the lineage-positive mucosal cell population. (C) CD14 and DC-SIGN colocalization. Rectal mucosal biopsy sections from a patient with unusually high numbers of CD14+ cells (red, left panel) are shown for illustrative purposes. Note that the majority of DC-SIGN+ cells (green, middle panel) are also CD14+ (yellow, right panel), consistent with the FACS data in panel B.
FIG. 2.
FIG. 2.
Virus binding to DC-SIGN+ mucosal cells and transfer to T cells. (A) SIV316-pseudotyped pNL-GFP viruses were used in binding to sorted populations of HLA-DR+/DC-SIGN+ and HLA-DR+/DC-SIGN gut cells from three different patients. HIV+ (○, ▵) and HIV (•) patient samples are indicated. The sorting gates were drawn as shown in Fig. 1A. The number of viral genomes bound per standard β-actin mRNA copy number in the HLA-DR+/DC-SIGN+ population in the absence of any pretreatment (virus only) was normalized to 100%. (B) The total mucosal cell suspension was exposed to HIV-1 JR-CSF, and the DC-SIGN+ and DC-SIGN populations were sorted from the HLA-DR+ gate. An aliquot of the unsorted virus-exposed MMCs was set aside. The amount of virus bound per β-actin message under each condition was normalized to that bound to the HLA-DR+/DC-SIGN+ population (set at 100%). HIV+ (○) and HIV (filled symbols) patient samples are indicated. (C) Total MMCs were exposed to HIV-1 JR-CSF with or without the DC-SIGN blocking antibody (clone 612 at 10 μg/ml), and the DC-SIGN+ and DC-SIGN populations were sorted from the HLA-DR+ gate. The amount of virus bound per β-actin message under each condition was normalized to that bound to the HLA-DR+/DC-SIGN+ population (set at 100%). The RT-PCR was run in quadruplicate and the error bars are shown, with asterisks denoting the DC-SIGN antibody, which significantly blocked virus binding. Results shown are for DC-SIGN+ cells (gray bars), DC-SIGN+ cells with blocking antibody (horizontal lined bars), DC-SIGN cells (black bars), DC-SIGN cells with blocking antibody (vertical and horizontal lined bars), MMCs (white bars), and MMCs with blocking antibody (vertical lined bars). (D) HIV-1 JR-CSF was titrated on peripheral blood MDDCs from 158 virions down to 1.58 virions/MDDC at the limit of detection. Five independent experiments are shown in circles, with the horizontal line indicating the average amount of HIV-1 virions detected per million β-actin messages. (E) At decreasing viral inocula, virus was added to MDDCs pretreated as indicated and the amount of virus bound was expressed as a percentage relative to the level of virus bound under the untreated (virus-only) condition. Inocula were 158 virions/MDDC (gray bars) and 15.8 virions/MDDC (black bars). A representative experiment of two is shown. (F) MMCs were exposed to JR-CSF, and DC-SIGN+ and DC-SIGN populations were sorted from the HLA-DR gate. Equal numbers of each sorted population were combined with day 2 phytohemagglutinin-stimulated CD4+ T cells at a 1:2 ratio. Supernatant was collected at days 1, 4, and 7, and a p24 enzyme-linked immunosorbent assay was performed to measure virus replication. Another transfer assay using a single-round SIV316-pseudotyped NL4-3-GFP virus also showed three- to fourfold greater transfer of virus in the DC-SIGN+ population over the DC-SIGN population (data not shown).
FIG. 3.
FIG. 3.
An increase in DC-SIGN+ cells in the gut mucosa of HIV+ patients. Gut mucosal tissue sections were stained for DC-SIGN and detected by immunofluorescence. The DC-SIGN+ cells were enumerated by computer-assisted quantitative morphometry. Eight sections from 4 HIV patients and 42 sections from 26 HIV+ patients were counted. The panels on the left show representative examples of patient samples with low, medium, and high numbers of DC-SIGN+ cells per standard area (defined as a 20× high-power field). The right panel is a graphical representation of the morphometric data obtained. At least five fields were counted per section; the data bar shown is the average count ± the SEM. The averages for all the HIV+ and HIV sections (± SEM) were calculated (red bars) and compared using Student's t test (two-tailed unequal variance).
FIG. 4.
FIG. 4.
The mucosal IL-10/IL-12 ratio is positively correlated with increased numbers of DC-SIGN+ cells in mucosal tissue sections from HIV+ patients. Quantitative real-time RT-PCR was performed for IL-10 and IL-12 on RNA isolated from most of the HIV+ tissue sections, which were also quantified for DC-SIGN expression in Fig. 3. The log of the ratio of IL-10/IL-12 (x axis) was plotted against the DC-SIGN count (y axis) for each tissue section. A Pearson's correlation, r, the 95% confidence interval (bounded by the dotted lines), and P value of the correlation were determined by using the GraphPad Prism software at r = 0.58 and P = 0.0020.
FIG. 5.
FIG. 5.
DC-SIGN+ cell frequency is negatively correlated with the mean fluorescent intensity (MFI) of the B7 family of costimulatory molecules. The percentage of DC-SIGN+ cells in the rectal MMC suspension was determined by flow cytometric gating on the lineage-negative, HLA-DR+, DC-SIGN+ cells in six HIV+ patients (○) and six HIV patients (•) (y axis). The ΔMFI of the B7 costimulatory molecules CD86 (A) and CD80 (B) on the lineage-negative, HLA-DR+, DC-SIGN+ cells was determined by subtracting the MFI of the isotype control staining from the MFI of either CD86 or CD80 (x axis). The Pearson's correlation, r, the 95% confidence interval (bounded by the dotted lines), and P value of the correlation were determined by using the GraphPad Prism software at r = −0.82 and P < 0.002 (A) and r = −0.81 and P < 0.003 (B). (C) Representative figure of how the data were collected for two points on the graph in panel A, representing high DC-SIGN frequency (5.8%) and low CD86 expression (ΔMFI of 56) (top two panels) and low DC-SIGN frequency (0.8%) and high CD86 expression (ΔMFI of 595) (bottom two panels).
FIG. 6.
FIG. 6.
MDDCs in the presence of IL-10 upregulate DC-SIGN expression, downregulate CD86 expression, and fail to mature and migrate to appropriate stimuli. (A) Monocytes were cultured with IL-4 (100 ng/ml) plus GM-CSF (50 ng/ml) with or without IL-10 (100 ng/ml) for 7 days. Half the cells were stimulated with LPS (10 ng/ml) and TNF-α (100 ng/ml) to induce maturation, and the other half was maintained in original cytokines in an immature state for 2 days. The expression levels of various markers were determined using CD86-TC, DC-SIGN-FITC, CD83-PE, and HLA-DR-APC by flow cytometric analysis, and the change in mean fluorescent intensity (ΔMFI) was calculated by subtracting the MFI of the isotype control staining from the MFI of the cell surface marker indicated. The error bars are derived from triplicate cultures of one patient as a representative figure of five culture experiments. Results shown are for immature MDDCs (black bars), mature MDDCs (vertical and horizontal lined bars), immature IL-10-derived MDDCs (gray bars), mature IL-10-derived MDDCs (horizontal bars). (B) MDDCs were exposed to 250 ng/ml of MIP3-β separated by a 0.5-μm polycarbonate membrane in a transwell system for 3 to 4 h. Cells that passed through were counted on a flow cytometer and expressed as the percent migration compared to medium only (no cytokine). The error bars represent the cumulative migration from four separate experiments. Mature MDDCs migrated to the MIP-β despite undetectable levels of CCR7 expression by flow cytometric analysis.

Similar articles

Cited by

References

    1. Anton, P. A., M. A. Poles, J. Elliott, S. H. Mao, I. McGowan, H. J. Lenz, and I. S. Chen. 2001. Sensitive and reproducible quantitation of mucosal HIV-1 RNA and DNA viral burden in patients with detectable and undetectable plasma viral HIV-1 RNA using endoscopic biopsies. J. Virol. Methods 95:65-79. - PubMed
    1. Banchereau, J., and R. M. Steinman. 1998. Dendritic cells and the control of immunity. Nature 392:245-252. - PubMed
    1. Baribaud, F., S. Pohlmann, G. Leslie, F. Mortari, and R. W. Doms. 2002. Quantitative expression and virus transmission analysis of DC-SIGN on monocyte-derived dendritic cells. J. Virol. 76:9135-9142. - PMC - PubMed
    1. Baribaud, F., S. Pohlmann, T. Sparwasser, M. T. Kimata, Y. K. Choi, B. S. Haggarty, N. Ahmad, T. Macfarlan, T. G. Edwards, G. J. Leslie, J. Arnason, T. A. Reinhart, J. T. Kimata, D. R. Littman, J. A. Hoxie, and R. W. Doms. 2001. Functional and antigenic characterization of human, rhesus macaque, pigtailed macaque, and murine DC-SIGN. J. Virol. 75:10281-10289. - PMC - PubMed
    1. Bell, S. J., R. Rigby, N. English, S. D. Mann, S. C. Knight, M. A. Kamm, and A. J. Stagg. 2001. Migration and maturation of human colonic dendritic cells. J. Immunol. 166:4958-4967. - PubMed

Publication types