Comparative Study
. 2005 Apr 13;25(15):3985-93.
doi: 10.1523/JNEUROSCI.0168-05.2005.

Sharing receptive fields with your neighbors: tuning the vertical system cells to wide field motion

Affiliations
Comparative Study

Sharing receptive fields with your neighbors: tuning the vertical system cells to wide field motion

Karl Farrow et al. J Neurosci. .

Abstract

In the blowfly, the direction-selective response of the 60 lobula-plate tangential cells has been ascribed to the integration of local motion information across their extensive dendritic trees. Because the lobula plate is organized retinotopically, the receptive fields of the tangential cells ought to be determined by their dendritic architecture. However, this appears not always to be the case. One compelling example is the exceptionally wide receptive fields of the vertical system (VS) tangential cells. Using dual-intracellular recordings, Haag and Borst (2004) found VS cells to be mutually coupled in such a way that each VS cell is connected exclusively to its immediate neighbors. This coupling may form the basis of the broad receptive fields of VS cells. Here, we tested this hypothesis directly by photoablating individual VS cells. The receptive field width of VS cells indeed narrowed after the ablation of single VS cells, specifically depending on whether the receptive field of the ablated cell was more frontal or more posterior to the recorded cell. In particular, the responses changed as if the neuron lost access to visual information from the ablated neuron and those VS cells more distal than it from the recorded neuron. These experiments provide strong evidence that the lateral connections among VS cells are a crucial component in the mechanism underlying their complex receptive fields, augmenting the direct columnar input to their dendrites.


Figures

Figure 1.
Figure 1.
VS cell network and receptive fields. A, Schematic network of VS cells. Above the VS6, VS4, and VS2 cells is a diagram of the receptive field of each cell (gray and black arrows). The black arrows indicate the central receptive field of each cell, whereas the gray arrows show its spatial extent. As one moves laterally in the lobula plate, the receptive fields move frontally in visual space. B, Single responses of a VS2 and VS4 cell recorded from the same flys how the basic response properties of VS cells. Note that both cells respond to downward motion with a graded shift in membrane potential. The response amplitude depends on the stimulus position (see arrows). For each trace, the stimulus was applied for 1 s. The scale bar is relevant for each trace. C, Responses of six VS cells to downward motion as a function of stimulus position. Zero degrees on the x-axis represents the position directly in front of the fly, and positive numbers represent positions on the same side on which the cells were recorded. Each data point is the mean response ± SEM, normalized with respect to its maximum. Note the strong overlap of VS1 (n = 12), VS2 (n = 7), and VS3 (n = 9) cells. In addition, the responses of the VS4 (n = 13), VS5 (n = 5), and VS6 (n = 6) cells shift posteriorly. deg, Degrees.
Figure 2.
Figure 2.
Proximal cell ablations. Three examples of the effect of ablating individual VS cells (B, E, H, green cells) on the receptive field of a neighbor or next-of-neighbor VS cell (B, E, H, red cells) are shown. In A, D, and G, the open circles connected with the blue line indicate the receptive field of the ablated cell (green cell), the filled orange circles indicate the receptive field of the VS cell in the intact animal (red cell), and the dark red filled squares indicate the receptive field after the green cell has been ablated. The x-axis shows the horizontal position at which the stimulus was applied. The receptive field for each set of recordings was normalized to the maximum response. Asterisks indicate positions at which significant changes between the preresponses versus postresponses of the recorded VS cell occurred (*p < 0.05; **p < 0.001). In C, F, and I, the relative difference [(post - pre)/pre × 100; in percentage] between the preresponses (orange) and the postresponses (dark red) at each stimulus location is shown. The vertical line indicates the stimulus position at which the intact (red) cell had it speak response. A, An example of the receptive field of a VS4 cell before (Pre) and after (Post) the ablation of a VS2 cell. The peak response of the VS2 cell was 2.2 mV. The peak response of the VS4 cell was 1.7 mV before and 2.4 mV after the ablation of the VS2 cell. B, VS4 and VS2 cells. C, Relative difference (percentage) of the preresponse versus the postresponse of the VS4 cell after the ablation of the VS2 cell. D, A second example of a neighbor-neighbor ablation, showing the deficit a VS5 (red) cell experiences after the ablation of a VS6 (green) cell. The peak response of the VS6 cell was 9.0 mV. The response of the VS5 cell was 4.6 mV before and 3.6 mV after the ablation of the VS5 cell. E, VS6 and VS5 cells. F, Relative difference (percentage) of the preresponse versus the postresponse of the VS5 cell after the ablation of the VS6 cell. G, A third example of a neighboring cell ablation, demonstrating the change in a VS1 (red) cell after the ablation of a VS3 (green) cell. The peak response of the VS3 cell was 4.4 mV. The peak response of the VS1 cell was 7.7 mV before and 5.6 mV after the ablation of the VS3 cell. H, VS1 and VS3 cells. I, Relative difference (percentage) of preresponse versus postresponse of the VS1 cell after the ablation of the VS3 cell. deg, Degrees.
Figure 4.
Figure 4.
Distal ablation. An example of a VS6 cell after the ablation of a distant VS1 cell is shown. A, Receptive field of a VS6 cell before (Pre) and after (Post) the ablation of a VS1 cell. The peak response of the VS1 cell was 8.2 mV. The peak response of the VS6 cell was 1.6 mV before and 1.7 mV after the ablation of the VS1 cell. B, Relative difference (percentage) of the response of the VS6 cell before versus after ablation.
Figure 7.
Figure 7.
VS1 cell ablation. Example recordings of a VS8 (red) cell before and after the ablation of a VS1 (green) cell. The vertical line separates the five frontal stimulus positions (the ablated side) from the five lateral stimulus positions (the intact side). A, Response of a VS8 cell to upward motion before (pre) and after (post) the ablation of a VS1 cell. The peak response of the VS1 cell was -6.6 mV, whereas that of the VS8 cell was 3.5 mV before and 3.7 mV after the ablation of the VS1 cell. The peak response of the VS8 cell was in its frontal receptive field. B, Relative difference (percentage) of the preresponse versus the postresponse of the VS8 cell to upward motion. C, Two recorded cells. D, Response of the same VS8 cell to downward motion before and after the ablation of a VS1 cell. The peak response of the VS1 cell was 14.5 mV, whereas that of the VS8 cell was normalized to 2.6 mV before and 2.1 mV after the ablation of the VS1 cell. The peak response of the VS8 cell was at the most posterior stimulus position. E, Relative difference (percentage) of the preresponse versus postresponse of the VS8 cell to downward motion. deg, Degrees.
Figure 3.
Figure 3.
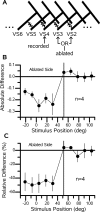
Deficit of a VS4 cell after the ablation of frontal viewing VS cells. A, Schematic of the VS cell network showing the relationship between the recorded cell (VS4) and the ablated cells (VS2 or VS3). B, Mean difference ± SEM of the receptive fields (postresponse minus preresponse) for a group of four VS4 cells in which either a VS2 (n = 1) or a VS3 (n = 3) cell was ablated. C, Relative difference [(post - pre)/pre × 100; in percentage] for the data shown in B. Note that, at each stimulus location frontal to the peak response of the VS4 cell, the response drops by approximately the same amount (∼50%). deg, Degrees.
Figure 5.
Figure 5.
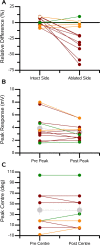
Summary of ablations. A, Mean relative difference between the postablation and preablation responses shown for both the ablated side and intact side of the receptive fields of the recorded VS cells. The ablated side consists of those stimulus positions at and beyond, from the point of view of the recorded cell, the peak of the ablated cell. The intact side comprises all other stimulus positions. In each graph, the red data points represent the neighbor ablations, the green data points represent the distant ablations, and the orange data points represent VS1 cell ablations while recording one of the medial VS cells. B, Peak responses for each experiment before and after the ablation of a single VS cell. The gray data points represent the mean ± SEM of all experiments. C, Peak response position for each cell before and after the ablation of another VS cell. The gray data points represent the mean ± SEM. deg, Degrees.
Figure 6.
Figure 6.
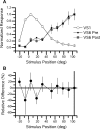
VS1 cell receptive fields. A, Schematic network of VS cells highlights the hypotheses of Haag and Borst (2004). It is unclear to which of the medial VS cells the VS1 cell provides inhibitory input. The receptive fields of the VS2, VS8, and VS10 cells are shown above the respective cell. The format is the same as that in Figure 1 A. F, Frontal; P, posterior. B, The receptive fields of the VS1 cell and the three most medial, posterior viewing VS cells in response to upward motion. See Figure 1 B for explanation. Note the overlap among the VS8 (n = 2), VS9 (n = 3), and VS10 (n = 2) cells. In addition, the VS1 cell appears to mirror that of the medial VS (n = 5) cells. deg, Degrees.

Similar articles

Cited by

References

    1. Bloomfield S, Völgyi B (2004) Function and plasticity of homologous coupling between AII amacrine cells. Vision Res 44: 3297-3306. - PubMed
    1. Borst A (2003) Noise, not stimulus entropy, determines neural information rate. J Comput Neurosci 14: 23-31. - PubMed
    1. Borst A, Egelhaaf M (1992) In vivo imaging of calcium accumulation in fly interneurons as elicited by visual motion stimulation. Proc Natl Acad Sci USA 89: 4139-4143. - PMC - PubMed
    1. Borst A, Haag J (2001) Effects of mean firing on neural information rate. J Comput Neurosci 10: 213-221. - PubMed
    1. de Ruyter van Steveninck R, Bialek W (1995) Reliability and statistical efficiency of a blowfly movement-sensitive neuron. Philos Trans R Soc Lond B Biol Sci 348: 321-340.

Publication types

LinkOut - more resources