Quantitative genomics of starvation stress resistance in Drosophila
- PMID: 15833123
- PMCID: PMC1088964
- DOI: 10.1186/gb-2005-6-4-r36
Quantitative genomics of starvation stress resistance in Drosophila
Abstract
Background: A major challenge of modern biology is to understand the networks of interacting genes regulating complex traits, and the subset of these genes that affect naturally occurring quantitative genetic variation. Previously, we used P-element mutagenesis and quantitative trait locus (QTL) mapping in Drosophila to identify candidate genes affecting resistance to starvation stress, and variation in resistance to starvation stress between the Oregon-R (Ore) and 2b strains. Here, we tested the efficacy of whole-genome transcriptional profiling for identifying genes affecting starvation stress resistance.
Results: We evaluated whole-genome transcript abundance for males and females of Ore, 2b, and four recombinant inbred lines derived from them, under control and starved conditions. There were significant differences in transcript abundance between the sexes for nearly 50% of the genome, while the transcriptional response to starvation stress involved approximately 25% of the genome. Nearly 50% of P-element insertions in 160 genes with altered transcript abundance during starvation stress had mutational effects on starvation tolerance. Approximately 5% of the genome exhibited genetic variation in transcript abundance, which was largely attributable to regulation by unlinked genes. Genes exhibiting variation in transcript abundance among lines did not cluster within starvation resistance QTLs, and none of the candidate genes affecting variation in starvation resistance between Ore and 2b exhibited significant differences in transcript abundance between lines.
Conclusions: Expression profiling is a powerful method for identifying networks of pleiotropic genes regulating complex traits, but the relationship between variation in transcript abundance among lines used to map QTLs and genes affecting variation in quantitative traits is complicated.
Figures


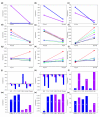
 (magenta), RI 42
 (light blue). (d, e) Sex × line interaction, averaged over treatments: (d) modulo; (e) l(2) giant larvae. (f-i) line × treatment interaction, averaged over sex: (f) CG11089; (g) Nervana 1; (h) Cyp9b2; (i) Peroxiredoxin 2540. (j, k) Sex × line × treatment interaction. The difference in expression between the starved and control treatments is plotted for females (magenta) and males (blue): (j) sallimus; (k) Esterase 6. (l-o) Regulation of transcript abundance. The same letters denote expression levels that are not significantly different. Magenta indicates 2b and blue indicates Ore genome. (l, m) Linked regulation of variation in transcript abundance: (l) UDP-glycosyltransferase 35b; (m) Signal recognition particle receptor b. (n, o) Unlinked regulation of variation in transcript abundance: (n) Arrestin 2; (o) Klarsicht.
References
-
- Norga KK, Gurganus MC, Dilda CL, Yamamoto A, Lyman RF, Patel PH, Rubin GM, Hoskins RA, Mackay TFC, Bellen HJ. Quantitative analysis of bristle number in Drosophila mutants identifies genes involved in neural development. Curr Biol. 2003;13:1388–1397. doi: 10.1016/S0960-9822(03)00546-3. - DOI - PubMed
Publication types
MeSH terms
Substances
LinkOut - more resources
Full Text Sources
Molecular Biology Databases

