

doi: 10.1186/gb-2005-6-4-r38.
Epub 2005 Mar 31.
Derivation of genetic interaction networks from quantitative phenotype data
Affiliations
- PMID: 15833125
- PMCID: PMC1088966
- DOI: 10.1186/gb-2005-6-4-r38
Item in Clipboard
Derivation of genetic interaction networks from quantitative phenotype data
Genome Biol.
2005.
Abstract
We have generalized the derivation of genetic-interaction networks from quantitative phenotype data. Familiar and unfamiliar modes of genetic interaction were identified and defined. A network was derived from agar-invasion phenotypes of mutant yeast. Mutations showed specific modes of genetic interaction with specific biological processes. Mutations formed cliques of significant mutual information in their large-scale patterns of genetic interaction. These local and global interaction patterns reflect the effects of gene perturbations on biological processes and pathways.
Figures
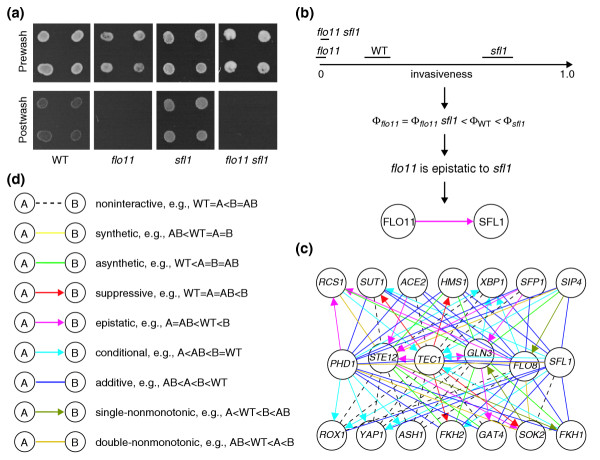
Application of the method to yeast agar invasion data to derive a genetic-interaction network. (a) Pre-wash and post-wash images of example genotypes in a yeast agar-invasion assay. (b) The invasion data shown on a phenotype axis with replicate-measurement error ranges, as a phenotype inequality, as a genetic-interaction mode, and as a graphical visualization. (c) Part of the network (only transcription factor genes) is shown. Nodes represent perturbed genes; edges represent genetic interactions. A key to the interactions is given in (d). (d) Graphical visualizations of genetic interaction modes and asymmetries, and example phenotype inequalities.

Gene perturbations show specific modes of genetic interaction with biological processes. (a) PBS2 deletion interacts additively with mutations of small-GTPase-mediated signal transduction genes. (b) PHD1 overexpression is hypostatic to deletions of invasive-growth genes. (c) ISW1 deletion suppresses the effects of perturbations of small-GTPase-mediated signal transduction genes. Key to interactions as in Figure 1d

Mutually informative genes show large-scale patterns of genetic interaction. Genetic interactions of STE12 and STE20 overexpressers. Key to interactions as in Figure 1d.

Networks of mutual information in patterns of genetic interaction show cliques. Nodes represent perturbed genes (see Additional data file 2). gf indicates a gain-of-function allele; lf indicates a loss-of-function allele. Edges connect gene pairs with significant mutual information in their patterns of genetic interaction (see Additional data file 6).
References
-
- Tewari M, Hu PJ, Ahn JS, Ayivi-Guedehoussou N, Vidalain PO, Li S, Milstein S, Armstrong CM, Boxem M, Butler MD, et al. Systematic interactome mapping and genetic perturbation analysis of a C. elegans TGF-beta signaling network. Mol Cell. 2004;13:469–482. doi: 10.1016/S1097-2765(04)00033-4. - DOI - PubMed
Publication types
MeSH terms
Grants and funding
LinkOut - more resources
Full Text Sources
Molecular Biology Databases
