

The gene expression signatures of melanoma progression
- PMID: 15833814
- PMCID: PMC1087936
- DOI: 10.1073/pnas.0501564102
The gene expression signatures of melanoma progression
Abstract
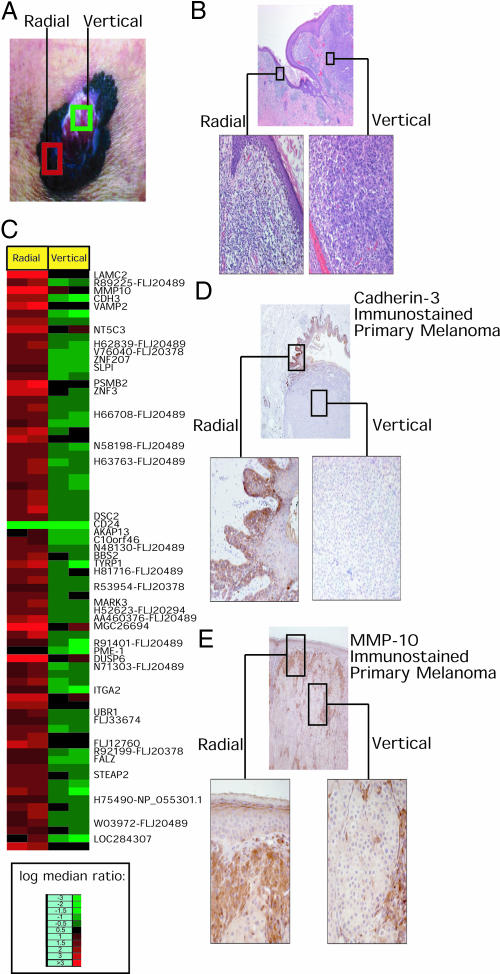
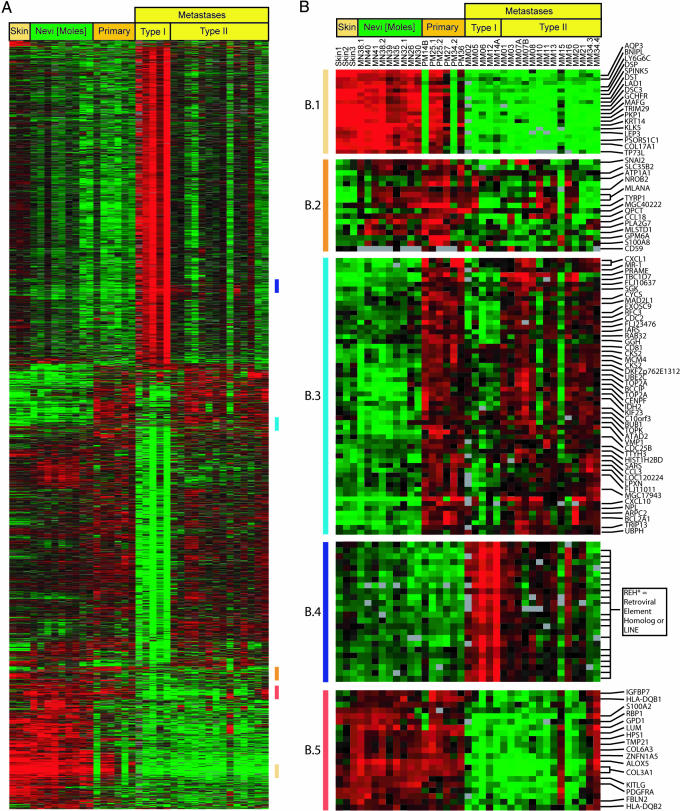
Because of the paucity of available tissue, little information has previously been available regarding the gene expression profiles of primary melanomas. To understand the molecular basis of melanoma progression, we compared the gene expression profiles of a series of nevi, primary melanomas, and melanoma metastases. We found that metastatic melanomas exhibit two dichotomous patterns of gene expression, which unexpectedly reflect gene expression differences already apparent in comparing laser-capture microdissected radial and vertical phases of a large primary melanoma. Unsupervised hierarchical clustering accurately separated nevi and primary melanomas. Multiclass significance analysis of microarrays comparing normal skin, nevi, primary melanomas, and the two types of metastatic melanoma identified 2,602 transcripts that significantly correlated with sample class. These results suggest that melanoma pathogenesis can be understood as a series of distinct molecular events. The gene expression signatures identified here provide the basis for developing new diagnostics and targeting therapies for patients with malignant melanoma.
Figures


References
-
- Balch, C. M., Buzaid, A. C., Soong, S. J., Atkins, M. B., Cascinelli, N., Coit, D. G., Fleming, I. D., Gershenwald, J. E., Houghton, A., Jr., Kirkwood, J. M., et al. (2001) J. Clin. Oncol. 19, 3635-3648. - PubMed
-
- Clark, W. H., Jr., Elder, D. E., Guerry, D., IV, Epstein, M. N., Greene, M. H. & Van Horn, M. (1984) Hum. Pathol. 15, 1147-1165. - PubMed
-
- Abramova, L., Slingluff, C. L., Jr., & Patterson, J. W. (2002) J. Cutan. Pathol. 29, 407-414. - PubMed
-
- Bittner, M., Meltzer, P., Chen, Y., Jiang, Y., Seftor, E., Hendrix, M., Radmacher, M., Simon, R., Yakhini, Z., Ben-Dor, A., et al. (2000) Nature 406, 536-540. - PubMed
-
- Pollock, P. M., Harper, U. L., Hansen, K. S., Yudt, L. M., Stark, M., Robbins, C. M., Moses, T. Y., Hostetter, G., Wagner, U., Kakareka, J., et al. (2003) Nat. Genet. 33, 19-20. - PubMed
Publication types
MeSH terms
Substances
Grants and funding
LinkOut - more resources
Full Text Sources
Other Literature Sources
Medical
Research Materials
