. 2005 Jul;89(1):107-19.
doi: 10.1529/biophysj.104.055681. Epub 2005 Apr 15.

Intra- and inter-islet synchronization of metabolically driven insulin secretion

Affiliations

Intra- and inter-islet synchronization of metabolically driven insulin secretion

Morten Gram Pedersen et al. Biophys J. 2005 Jul.

Abstract

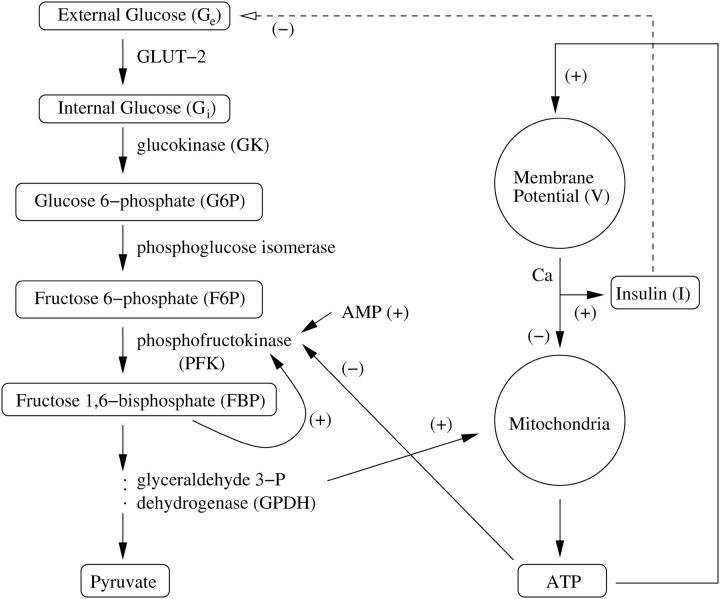
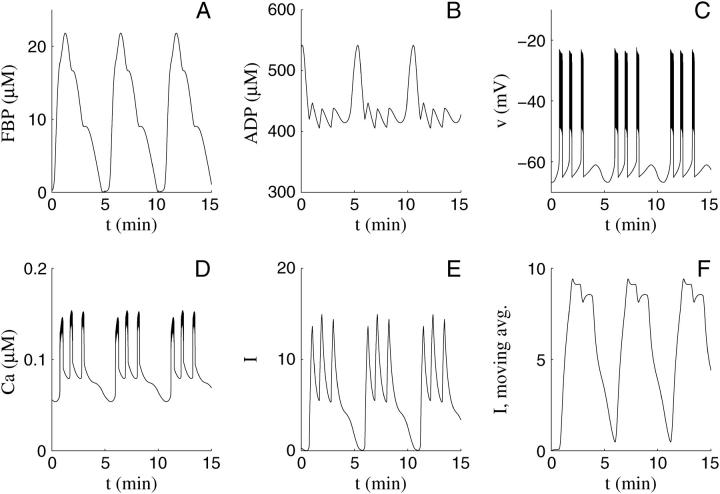
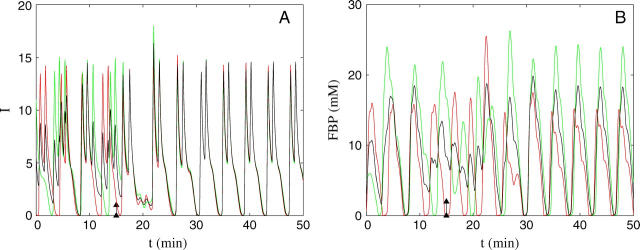
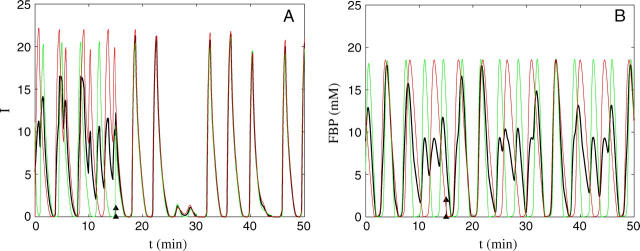
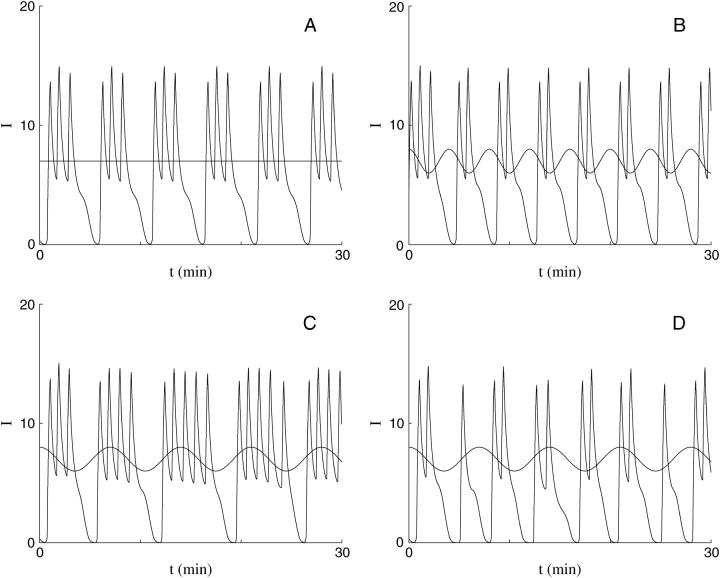
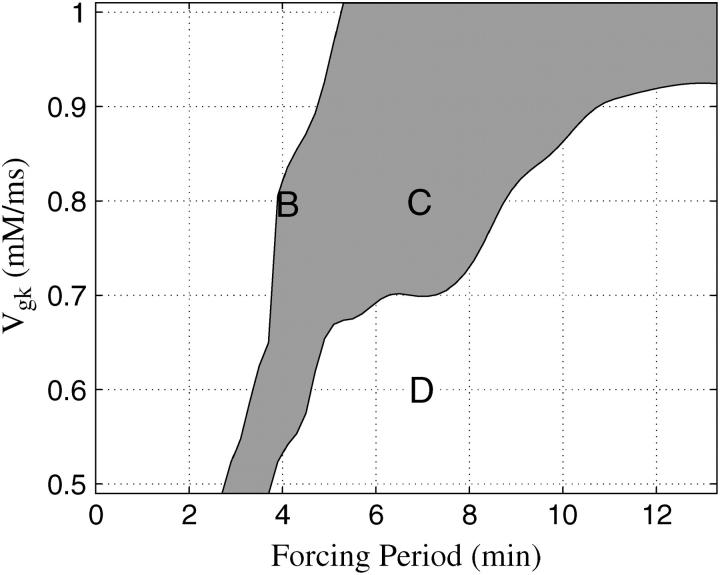
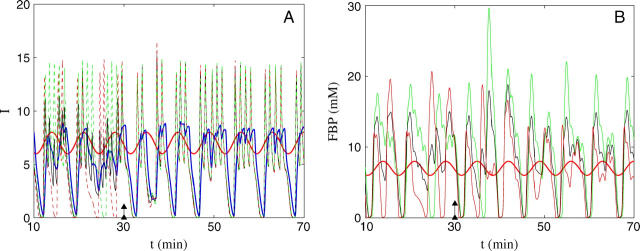
Insulin secretion from pancreatic beta-cells is pulsatile with a period of 5-10 min and is believed to be responsible for plasma insulin oscillations with similar frequency. To observe an overall oscillatory insulin profile it is necessary that the insulin secretion from individual beta-cells is synchronized within islets, and that the population of islets is also synchronized. We have recently developed a model in which pulsatile insulin secretion is produced as a result of calcium-driven electrical oscillations in combination with oscillations in glycolysis. We use this model to investigate possible mechanisms for intra-islet and inter-islet synchronization. We show that electrical coupling is sufficient to synchronize both electrical bursting activity and metabolic oscillations. We also demonstrate that islets can synchronize by mutually entraining each other by their effects on a simple model "liver," which responds to the level of insulin secretion by adjusting the blood glucose concentration in an appropriate way. Since all islets are exposed to the blood, the distributed islet-liver system can synchronize the individual islet insulin oscillations. Thus, we demonstrate how intra-islet and inter-islet synchronization of insulin oscillations may be achieved.


Figures

FIGURE 1
FIGURE 1
An overview of the pathways in the model. Glucose enters the β-cell through GLUT-2 transporters, and is broken down during glycolysis. (Left column) Part of the glycolytic pathway, highlighting the enzyme PFK and its regulators. The products of glycolysis feed into the mitochondria where ATP is produced. ATP links the glycolytic component to the electrical component (right column) by regulating K(ATP)-channels. These, in turn, regulate membrane potential and Ca2+ flow leading to insulin secretion. The electrical/Ca2+ component is linked back to glycolysis through Ca2+ regulation of ATP production and AMP/ATP feedback onto PFK. (Dashed line) Function of insulin to lower the plasma glucose concentration through the actions of the liver. The negative insulin feedback is added to the model when in vivo synchronization is discussed.
FIGURE 2
FIGURE 2
Compound bursting leading to pulsatile insulin secretion for a constant glucose stimulus, Ge = 7 mM, with Vgk = 0.8 mM/ms. The period of the pulses is 5.2 min.
FIGURE 3
FIGURE 3
The natural period of the pulsatile insulin secretion as a function of the glucose sensitivity parameter Vgk. The solid curve is produced by increasing Vgk, using the previous solution as initial conditions, whereas the dashed line is generated by decreasing Vgk. The shaded area indicates the region of bistability between stationary glycolysis and oscillatory glycolysis.
FIGURE 4
FIGURE 4
Two cells become synchronized when electrically coupled. Parameters as in Fig. 2, except Vgk, 1 = 0.6 mM/ms, Vgk, 2 = 0.8 mM/ms, and gc is raised from 0 pS to 100 pS at t = 15 min (arrow). (A) Rapid synchronization of insulin secretion. Red is the faster I1, green is the slower I2, and black is the average insulin secretion formula image from the two cells. (B) Slower synchronization of glycolysis. Red is FBP1, green is FBP2, and black is the average of the two cells.
FIGURE 5
FIGURE 5
Without Ca2+ feedback the cells do not synchronize glycolysis when electrically coupled. The absence of feedback is attained by keeping Ca = 0.1 μM constant in Eq. 9. The parameters are as in Table 1 except Vgk, 1 = 0.6 mM/ms, Vgk, 2 = 0.5 mM/ms, κ1 = 0.003, κ2 = 0.004, formula imageK, ATP = 37,000 pS, and gc is raised from 0 pS to 100 pS at t = 15 min (arrow). (A) Rapid synchronization of insulin secretion. Red is the slower I1, green is the faster I2, and black is the average insulin secretion formula image from the two cells. (B) Lack of synchronization of glycolysis. Red is FBP1, green is FBP2, and black is the average of the two cells.
FIGURE 6
FIGURE 6
Entrainment of the pulsatile insulin secretion to a sinusoidal glucose stimulus. (A) The natural pulsatile insulin secretion with Vgk = 0.8 mM/ms and constant Ge = 7 mM. The period of the pulses is ∼5 min. (B) Entrainment to a faster oscillating glucose stimulus with a period of 4 min. Vgk = 0.8 mM/ms. (C) Entrainment to a slower oscillating glucose stimulus with a period of 7 min. Vgk = 0.8 mM/ms. (D) Lack of entrainment to a glucose stimulus with a period of 7 min when Vgk is reduced to 0.6 mM/ms. All glucose oscillations are centered at ∼Ge = 7 mM with 1 mM amplitude.
FIGURE 7
FIGURE 7
The entrainment window (shaded) for a range of values of Vgk and period of the Ge oscillations (Forcing Period). Glucose oscillations are 1 mM in amplitude, with an approximate mean value of 7 mM. BD correspond to the panels in Fig. 6.
FIGURE 8
FIGURE 8
Two cells are entrainable to a stimulus with a larger period when coupled. Parameters as in Fig. 4, except gc is raised from 0 pS to 100 pS at t = 30 min (arrow). The glucose concentration (sinusoidal red curves) oscillates with a period of 7 min and amplitude of 1 mM. (A) Entrainment of insulin secretion. Red is the faster non-entrainable cell, green is the slower entrainable cell, and black is the average insulin secretion formula image from the two cells. The blue curve is the 1-min moving average of formula image (B) Entrainment of glycolysis. The color scheme is the same as in A.
FIGURE 9
FIGURE 9
A population of 20 islets becomes synchronized by an oscillatory glucose stimulus, resulting in pulsatile insulin secretion. The figure shows the insulin secretion averaged over the 20 islets (dotted black line), the average insulin secretion smoothed using a 1-min moving average (blue), and the glucose concentration (red), which is either constant or oscillatory with a period of 7 min and an amplitude of 1 mM. Vgk, i, i = 1, … , 20 are randomly chosen from a uniform distribution over [0.6, 0.9] mM/ms.
FIGURE 10
FIGURE 10
(A) 20 islets become synchronized when coupled through the plasma glucose concentration. The value Ge is dynamic from t = 20 min. Legends and Vgk, i as in Fig. 9. (B) Islets without pulsatile secretion can become pulsatile when coupled through the plasma glucose concentration. The value Ge is dynamic from t = 10 min. Vgk, i = 0.85 + 0.02i mM/ms, i = 1, …, 9.
FIGURE 11
FIGURE 11
(A) The smoothed insulin signal from Fig. 10 A (blue curve) is compared to the smoothed insulin signal when the glucose concentration remains fixed (black dashed curve). (B) The normalized power spectra of the two signals from the last 30 min (t from 30 to 60 min) of A with dynamic (blue curve) or fixed (black dashed curve) glucose concentration.

Similar articles

Cited by

References

    1. Chou, H. F., and E. Ipp. 1990. Pulsatile insulin secretion in isolated Rat islets. Diabetes. 39:112–117. - PubMed
    1. Sturis, J., W. L. Pugh, J. Tang, D. M. Ostrega, J. S. Polonsky, and K. S. Polonsky. 1994. Alterations in pulsatile insulin secretion in the Zucker diabetic fatty rat. Am. J. Physiol. Endocrinol. Metab. 267:E250–E259. - PubMed
    1. Pørksen, N. 2002. The in vivo regulation of pulsatile insulin secretion. Diabetologia. 45:3–20. - PubMed
    1. Longo, E. A., K. Tornheim, J. T. Deeney, B. A. Varnum, D. Tillotson, M. Prentki, and B. E. Corkey. 1991. Oscillations in cytosolic free Ca2+, oxygen consumption, and insulin secretion in glucose-stimulated Rat pancreatic islets. J. Biol. Chem. 266:9314–9319. - PubMed
    1. Tornheim, K. 1997. Are metabolic oscillations responsible for normal oscillatory insulin secretion? Diabetes. 46:1375–1380. - PubMed

Publication types

MeSH terms