. 2005 Jul;89(1):337-52.
doi: 10.1529/biophysj.104.055343. Epub 2005 Apr 15.

Specific and nonspecific hybridization of oligonucleotide probes on microarrays

Affiliations

Specific and nonspecific hybridization of oligonucleotide probes on microarrays

Hans Binder et al. Biophys J. 2005 Jul.

Abstract

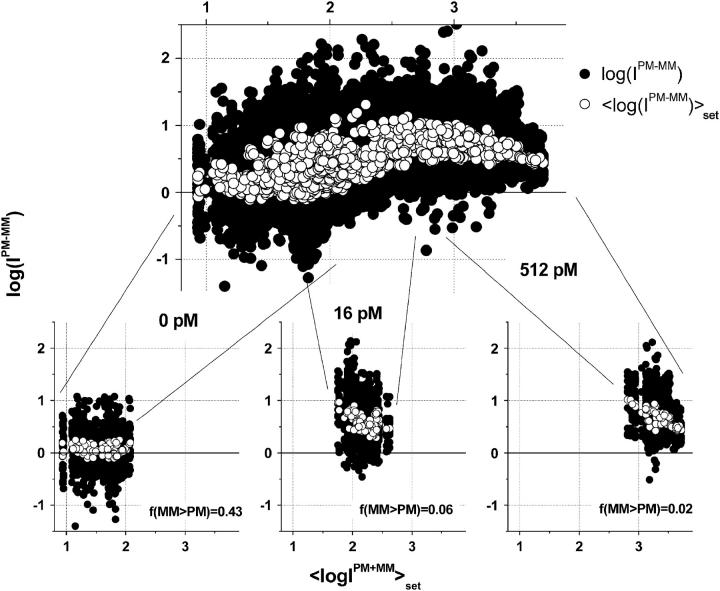
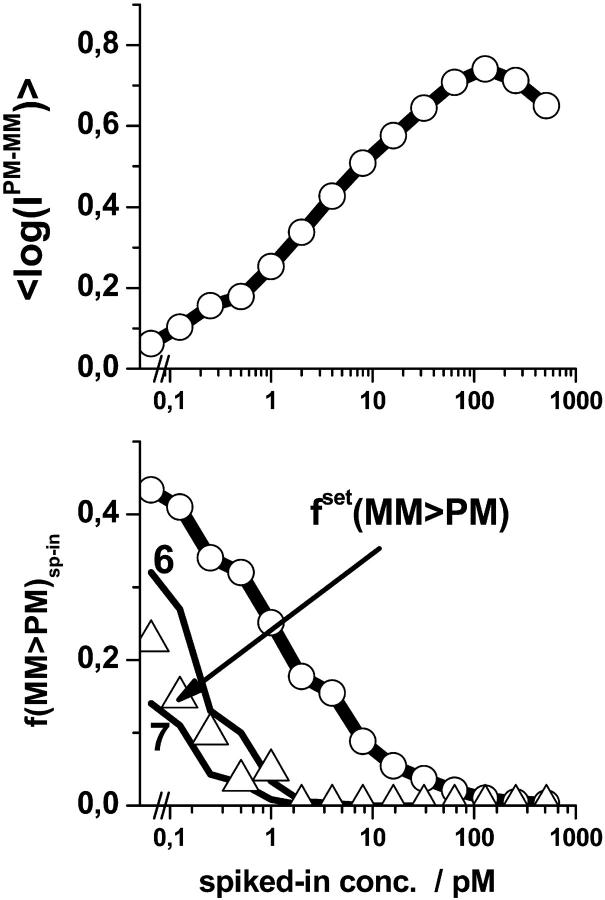
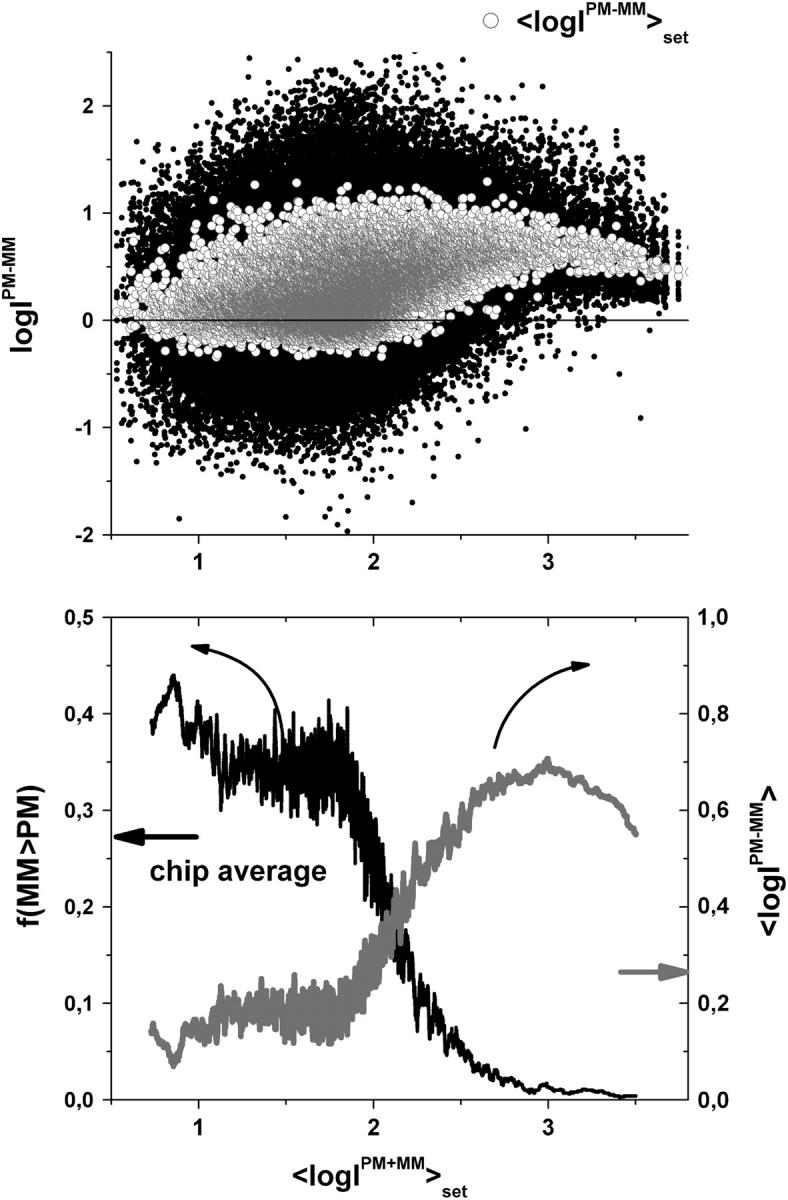
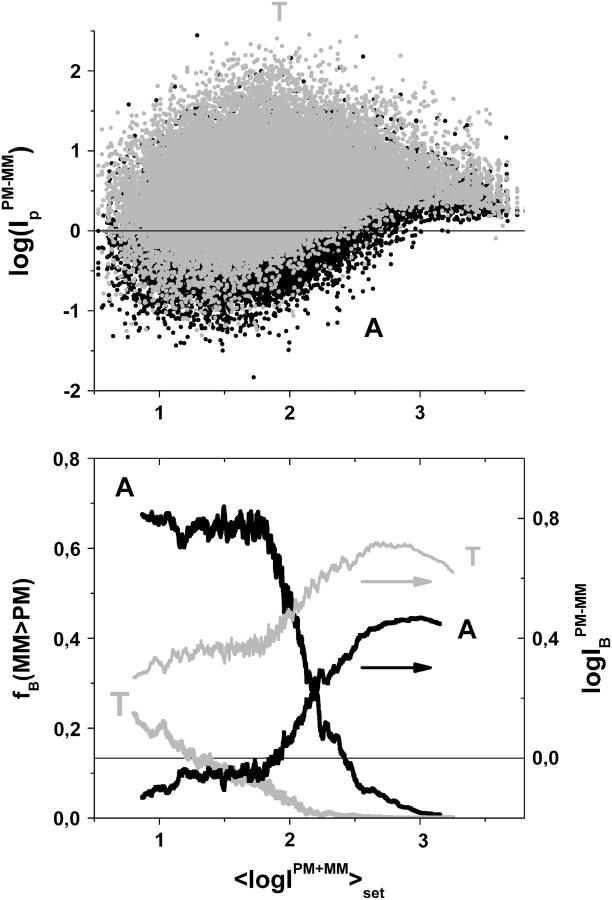
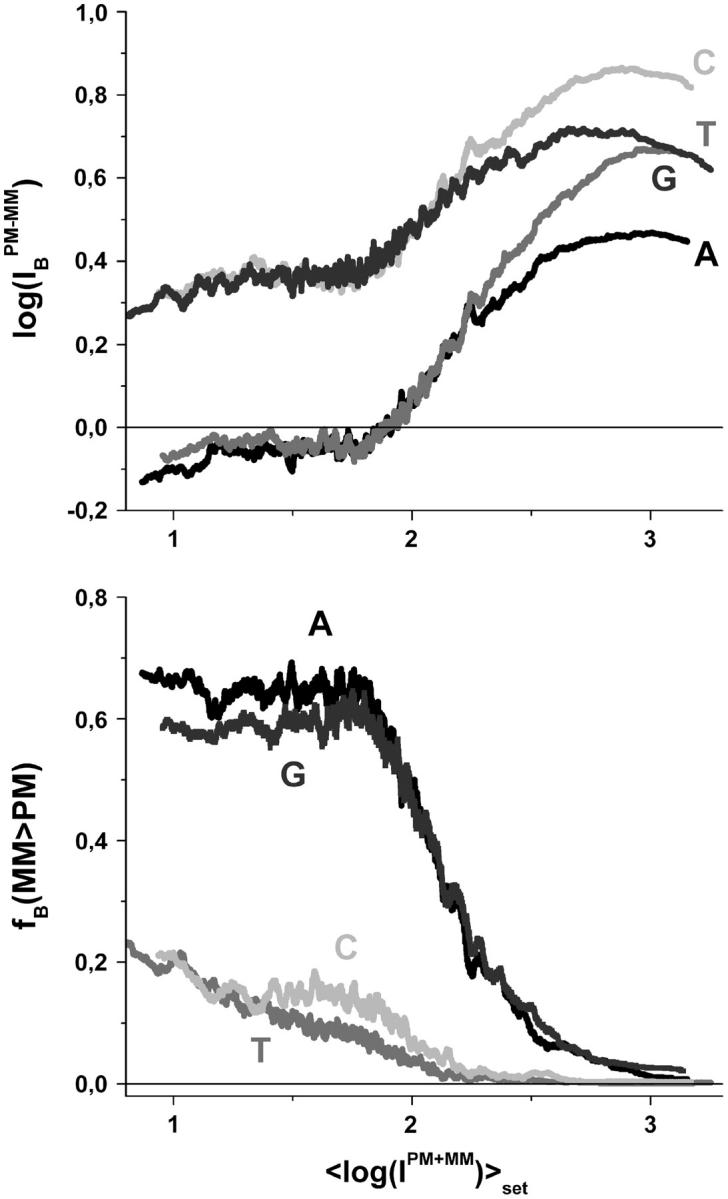
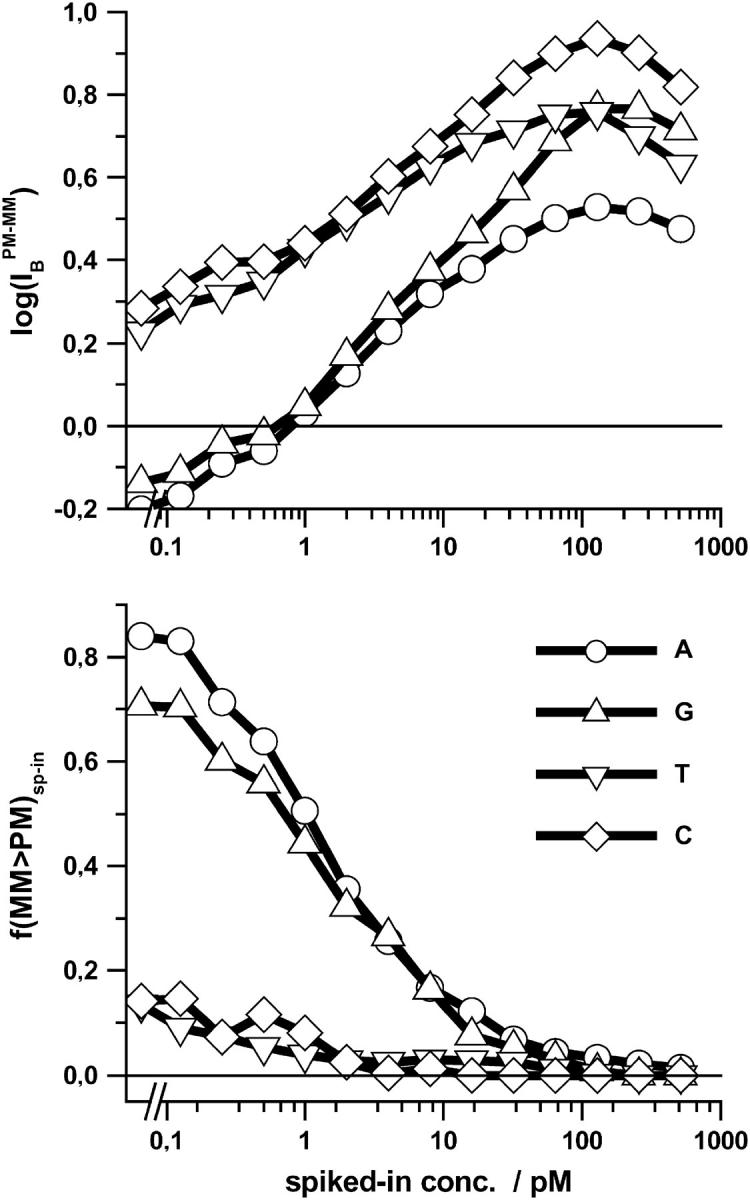
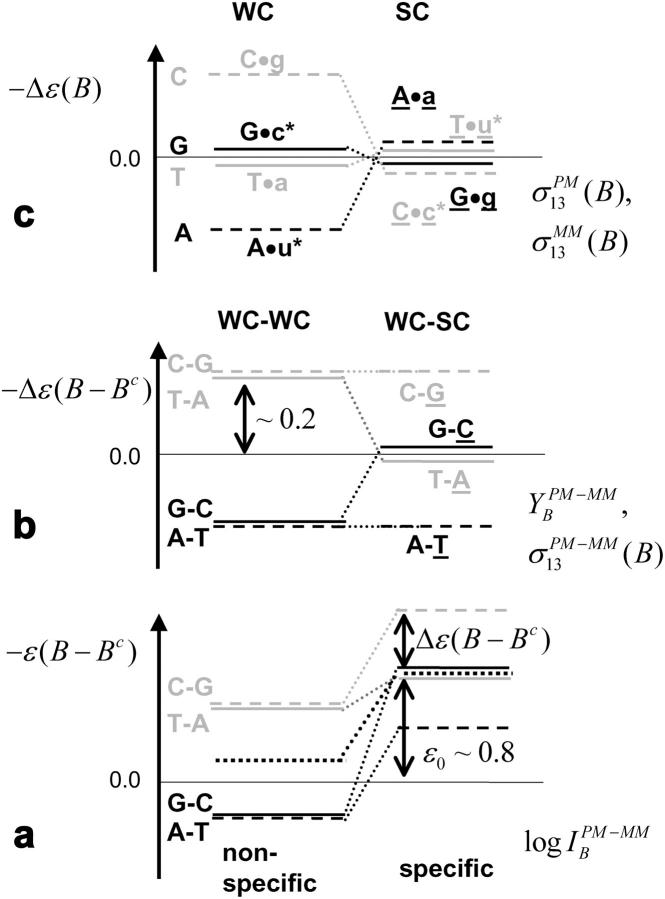
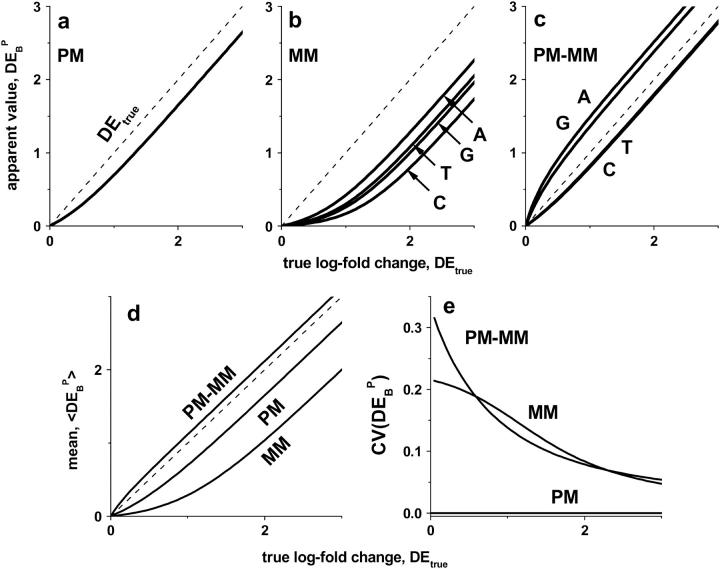
Gene expression analysis by means of microarrays is based on the sequence-specific binding of RNA to DNA oligonucleotide probes and its measurement using fluorescent labels. The binding of RNA fragments involving sequences other than the intended target is problematic because it adds a chemical background to the signal, which is not related to the expression degree of the target gene. The article presents a molecular signature of specific and nonspecific hybridization with potential consequences for gene expression analysis. We analyzed the signal intensities of perfect match (PM) and mismatch (MM) probes of GeneChip microarrays to specify the effect of specific and nonspecific hybridization. We found that these events give rise to different relations between the PM and MM intensities as function of the middle base of the PM, namely a triplet-like (C > G approximately T > A > 0) and a duplet-like (C approximately T > 0 > G approximately A) pattern of the PM-MM log-intensity difference upon binding of specific and nonspecific RNA fragments, respectively. The systematic behavior of the intensity difference can be rationalized on the level of basepairings of DNA/RNA oligonucleotide duplexes in the middle of the probe sequence. Nonspecific binding is characterized by the reversal of the central Watson-Crick (WC) pairing for each PM/MM probe pair, whereas specific binding refers to the combination of a WC and a self-complementary (SC) pairing in PM and MM probes, respectively. The Gibbs free energy contribution of WC pairs to duplex stability is asymmetric for purines and pyrimidines of the PM and decreases according to C > G approximately T > A. SC pairings on the average only weakly contribute to duplex stability. The intensity of complementary MM introduces a systematic source of variation which decreases the precision of expression measures based on the MM intensities.


Figures

FIGURE 1
FIGURE 1
Log-intensity difference, logIPM−MM = logIPM − logIMM, of the spiked-in probes taken from the LS experiment as a function of the mean set averaged intensity, 〈logIPM+MMset = 0.5〈(logIPM + logIMM)〉set, which serves as an approximate measure of the specific transcript concentration. Intensity averages over the probe sets are shown by open circles. The lower panel shows the log-differences for three selected spiked-in concentrations. Each concentration spans a range of ∼δ〈logIPM+MM〉 ≈ ±0.5 as indicated by the lines between the two panels. Note that the log-intensity difference shifts upwards with increasing 〈logIPM+MMset indicating the progressive decrease of the fraction of bright MM with increasing amounts of specific transcripts.
FIGURE 2
FIGURE 2
The fraction of bright MM, f(MM > PM) (lower panel) and the mean log-intensity difference, 〈logIPM-MMsp-in (upper panel), of the spiked-in probes taken from the LS experiment strongly correlate with the concentration of specific transcripts. The respective fraction of probe sets, fset(MM > PM), meeting the condition 〈logIPM-MMset < 0 is shown by triangles in the lower panel. The data can be well explained by the probability that >n(min) = 6–7 individual probe pairs of the set independently possesses bright MM using the Binominal distribution (see lines denoted by 6 and 7, respectively).
FIGURE 3
FIGURE 3
Log-intensity difference between PM and MM probes of the whole data set of ∼250,000 probes of an HG U133 chip (upper panel), fraction of bright MM (lower panel, left ordinate) and mean log-intensity difference (lower panel, right ordinate) as a function of the mean set averaged intensity. The fraction of bright MM and the mean difference were calculated as running averages over 1000 subsequent probes along the abscissa. Note the agreement with the respective data obtained from the spiked-in data set (Figs. 1 and 2). It shows that the dependence of the probe intensities on the concentration of specific transcripts applies to the whole set of probes of the chip.
FIGURE 4
FIGURE 4
The figure shows the same type of data as in Fig. 3; however, only probe pairs with a G and a C in the middle of the PM sequence are selected (see the figure for assignments). The data referring to the pyrimidine and purine middle base are shifted in vertical direction to each other. Compare with Fig. 5 and see also legend of Fig. 3.
FIGURE 5
FIGURE 5
The figure shows the same type of data as in Fig. 3; however, only probe pairs with a T and an A in the middle of the PM sequence are selected (see the figure for assignments). Compare with Fig. 4 and see also legend of Fig. 3.
FIGURE 6
FIGURE 6
Fraction of bright MM (lower panel) and mean log-intensity difference (upper panel) for probe pairs with a B = A, T, G, C in the middle of the PM sequence (see the figure for assignments) as a function of the mean set averaged intensity. The data were replotted from Figs. 4 and 5 (see the respective legends for details). The data refer to the whole data set of ∼250,000 probes of a HG U133 chip. Note that the log-intensity differences split in to a duplet-like pattern at small abscissa values referring to nonspecific hybridization and into a triplet-like pattern at high abscissa values referring to specific hybridization (see upper panel).
FIGURE 7
FIGURE 7
Fraction of bright MM (lower panel) and mean log-intensity difference (upper panel) for probe pairs with B = A, T, G, C in the middle of the PM sequence (see the figure for assignments) as a function of the concentration of specific transcripts. The data refer to the spiked-in data set of 462 different probes. Compare with Fig. 6. Both Figs. 6 and 7 show essential identical properties for the spiked-in and the full set of probes.
FIGURE 8
FIGURE 8
Middle-base related sensitivity of probe pairs with B = A, T, G, C in the middle of the PM sequence (see the figure for assignments and Eq. 2) as a function of the concentration of specific transcripts. The concentration ranges of dominating nonspecific (NS) and of specific (S) hybridization are indicated by vertical dotted lines. The duplet in the limit of nonspecific hybridization transforms into a triplet-like pattern in the limit of specific hybridization. The sensitivity provides a measure of the base-specific contribution to the free energy of RNA/DNA duplex stability.
FIGURE 9
FIGURE 9
Positional dependent single-base sensitivity profile of the PM (symbols) and MM (lines) probes in the limit of nonspecific (left) and specific (right) hybridization. The two lower panels show the respective PM-MM difference profiles (see Eq. 5). Note that the PM-MM difference of the middle base considerably exceeds the contributions of the bases at the remaining positions along the sequence.
FIGURE 10
FIGURE 10
Schematic illustration of the basepairing in the middle of the sequence of PM (left) and MM (right) probes upon duplex formation with specific (upper panel) and nonspecific (lower panel) transcripts. The example shows a probe pair with middle-bases G and C of the PM and MM probes, respectively. Upper-case letters refer to the DNA probes and lower-case letters to the RNA transcripts (asterisk indicates labeling). The middle base effectively forms Watson-Crick pairings in the nonspecific duplexes of the PM as well in the nonspecific duplexes of the MM (i.e., C·g and G·c* in the chosen example, respectively). It also forms a Watson-Crick pair in the specific duplexes of the PM probes but a self-complementary pair in the specific duplexes of the MM probes (i.e., C·g for the PM and G·g for the MM). Note that the remaining positions along the probe sequences are partly mismatched in the nonspecific duplexes.
FIGURE 11
FIGURE 11
Schematic energy level diagram of the Gibbs free energy of basepairings and their differences at the central position of PM and MM probes in the limit of nonspecific (left) and specific (right) hybridization. (a) Difference of the respective total free energy contribution of complementary bases (see Eqs. 11 and 16); (b) difference of the base-specific incremental contribution; and (c) base-specific incremental free energy contribution. The free energy terms were estimated using the log-intensity difference, formula image (a, compare with Figs. 3–5), the sensitivity differences formula image and formula image (b, compare with Fig. 8) and the single-base sensitivity terms, formula image and formula image (compare with Fig. 9). See text.
FIGURE 12
FIGURE 12
Apparent differential expression, formula image, as a function of the true log-fold change of the RNA-target concentration, DEtrue. The apparent values were calculated using the log-fold change of the probe intensities as described in the Appendix (see also Eq. 18). The PM-only (a) and MM-only (b) intensity data underestimate the true value whereas the PM-MM intensity difference provides an acceptable measure of DEtrue (c). Note that formula image depends on the middle-base B = A, T, G, C for P = MM and PM-MM. Panels d and e show the mean values, formula image, which are averaged over the four possible middle bases and the respective coefficient of variation, formula image, respectively. The deviation of formula image from DEtrue specifies the accuracy and formula image is inversely related to the precision of the respective measure of gene expression (see text).

Similar articles

Cited by

References

    1. Lipshutz, R. J., S. P. A. Fodor, T. R. Gingeras, and D. J. Lockhart. 1999. High density synthetic oligonucleotide arrays. Nat. Genet. 21:20–24. - PubMed
    1. Matveeva, O. V., S. A. Shabalina, V. A. Nemtsov, A. D. Tsodikov, R. F. Gesteland, and J. F. Atkins. 2003. Thermodynamic calculations and statistical correlations for oligo-probes design. Nucleic Acids. Res. 31:4211–4217. - PMC - PubMed
    1. Affymetrix. 2001. Affymetrix Microarray Suite 5.0. In User Guide. Affymetrix, Inc., Santa Clara, CA.
    1. Li, C., and W. H. Wong. 2001. Model-based analysis of oligonucleotide arrays: expression index computation and outlier detection. Proc. Natl. Acad. Sci. USA. 98:31–36. - PMC - PubMed
    1. Li, C., and W. H. Wong. 2001. Model-based analysis of oligonucleotide arrays: model validation, design issues and standard error application. Genome Biol. 2:1–11. - PMC - PubMed

Publication types

LinkOut - more resources