. 2005 May;138(1):341-51.
doi: 10.1104/pp.104.059147. Epub 2005 Apr 15.

Arabidopsis CBF3/DREB1A and ABF3 in transgenic rice increased tolerance to abiotic stress without stunting growth

Affiliations

Arabidopsis CBF3/DREB1A and ABF3 in transgenic rice increased tolerance to abiotic stress without stunting growth

Se-Jun Oh et al. Plant Physiol. 2005 May.

Abstract

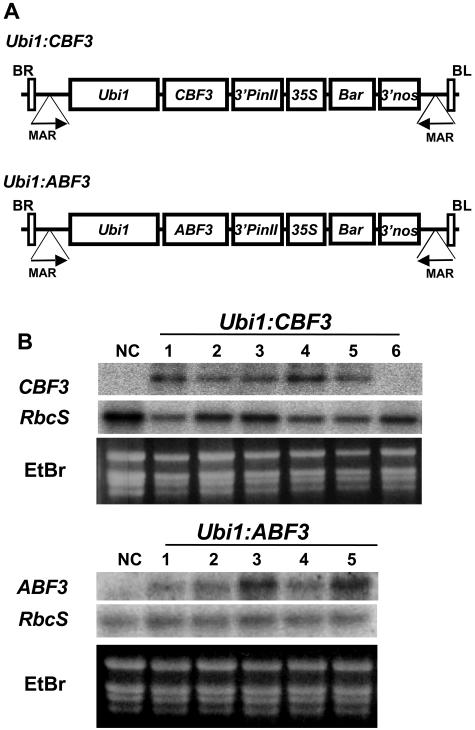
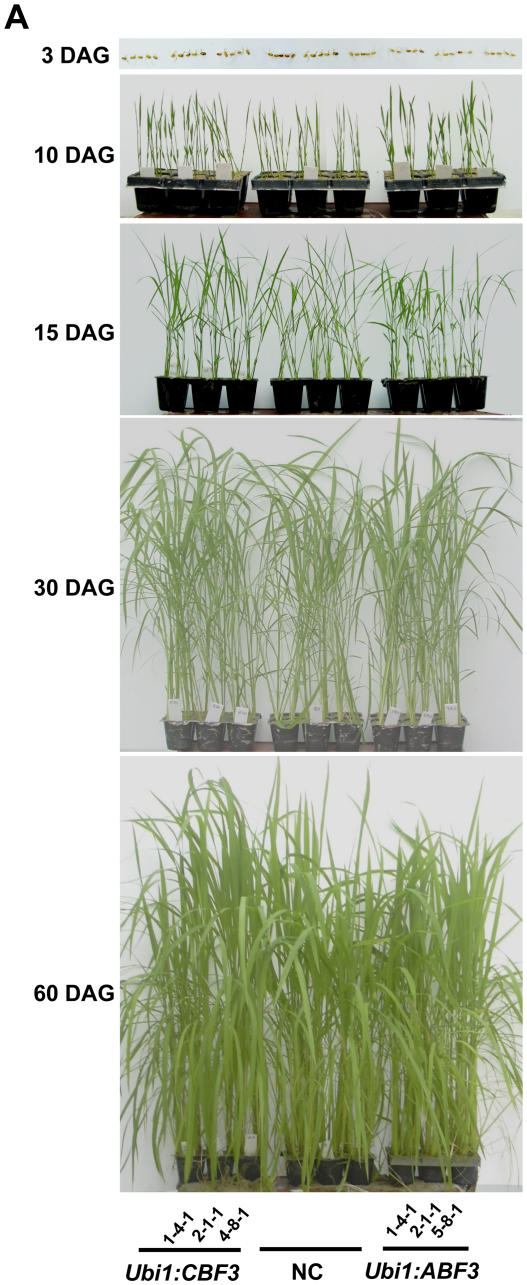
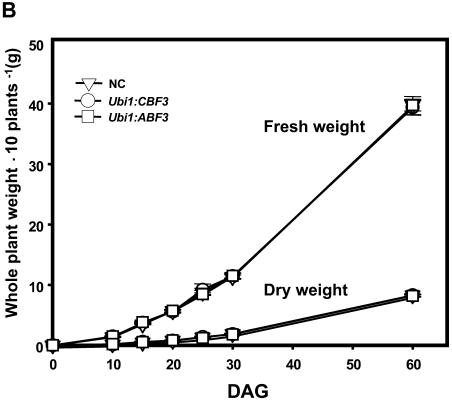
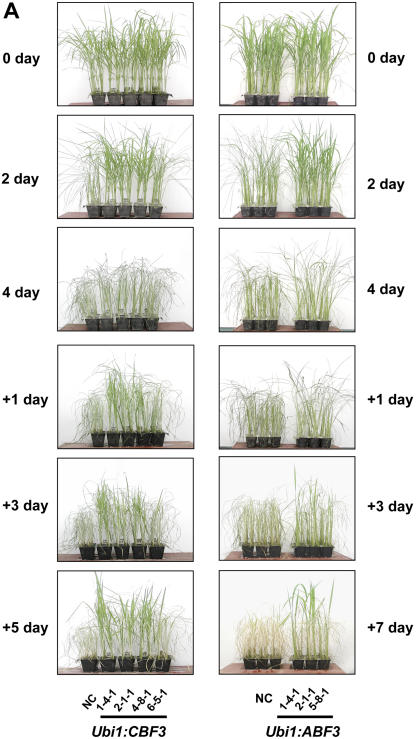
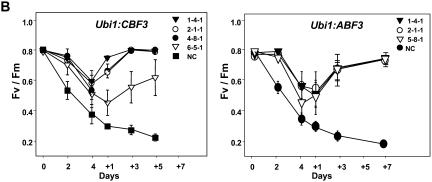
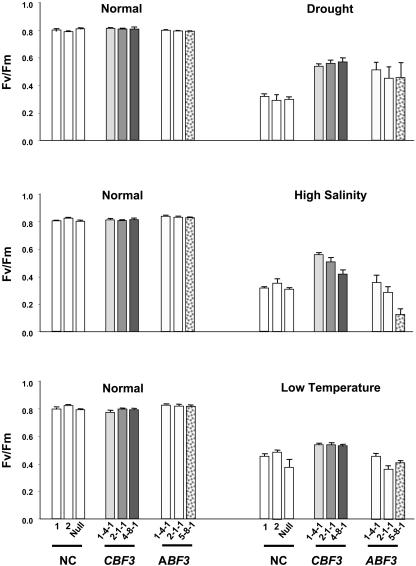
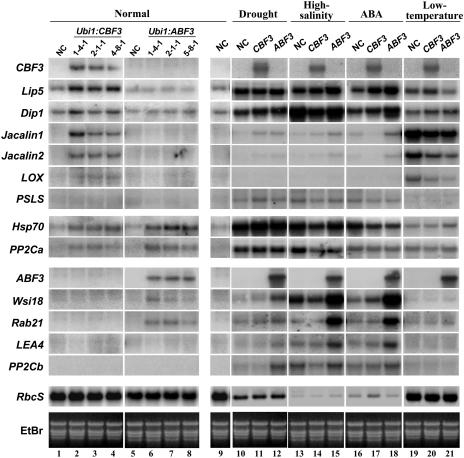
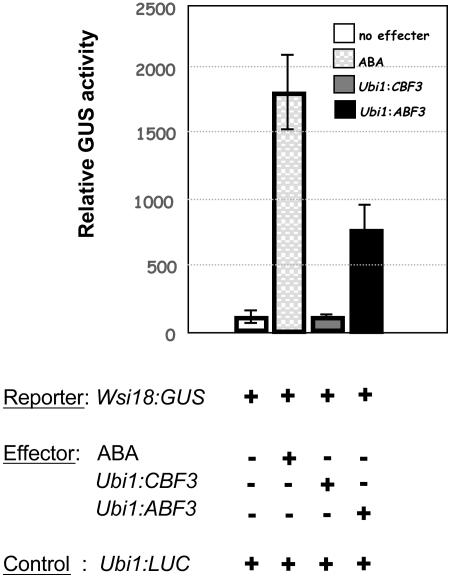
Rice (Oryza sativa), a monocotyledonous plant that does not cold acclimate, has evolved differently from Arabidopsis (Arabidopsis thaliana), which cold acclimates. To understand the stress response of rice in comparison with that of Arabidopsis, we developed transgenic rice plants that constitutively expressed CBF3/DREB1A (CBF3) and ABF3, Arabidopsis genes that function in abscisic acid-independent and abscisic acid-dependent stress-response pathways, respectively. CBF3 in transgenic rice elevated tolerance to drought and high salinity, and produced relatively low levels of tolerance to low-temperature exposure. These data were in direct contrast to CBF3 in Arabidopsis, which is known to function primarily to enhance freezing tolerance. ABF3 in transgenic rice increased tolerance to drought stress alone. By using the 60 K Rice Whole Genome Microarray and RNA gel-blot analyses, we identified 12 and 7 target genes that were activated in transgenic rice plants by CBF3 and ABF3, respectively, which appear to render the corresponding plants acclimated for stress conditions. The target genes together with 13 and 27 additional genes are induced further upon exposure to drought stress, consequently making the transgenic plants more tolerant to stress conditions. Interestingly, our transgenic plants exhibited neither growth inhibition nor visible phenotypic alterations despite constitutive expression of the CBF3 or ABF3, unlike the results previously obtained from Arabidopsis where transgenic plants were stunted.


Figures

Figure 1.
Figure 1.
Production of Ubi1:CBF3 and Ubi1:ABF3 plants. A, Ubi1:CBF3 and Ubi1:ABF3 consist of the maize ubiquitin promoter (Ubi1) linked to the CBF3 and ABF3 coding regions, respectively, and the 3′-region of the potato proteinase inhibitor II gene (3′pinII), and a gene expression cassette that contains the 35S promoter, the bar coding region, and the 3′-region of the nopaline synthase gene (3′nos). The entire expression cassette is flanked by the 5′-matrix attachment region (MAR) of the chicken lysozyme gene (Phi-Van and Strätling, 1996). B, RNA gel-blot analysis was performed using total RNAs from young leaves of 6 Ubi1:CBF3 (top) and 5 Ubi1:ABF3 (bottom) lines and from NC plants. The blots were hybridized with the CBF3 and ABF3 probes (described in Supplemental Fig. 1) and reprobed with the rice RbcS gene (Kyozuka et al., 1993). Ethidium bromide (EtBr) staining of total RNA was for equal loading of RNAs.
Figure 2.
Figure 2.
Growth characteristics of Ubi1:CBF3 and Ubi1:ABF3 plants. A, Growth phenotypes of 3 independent T4 homozygous lines for Ubi1:CBF3, Ubi1:ABF3, and NC plants at indicated days after germination (DAG). B, Dry weight and fresh weight accumulation of Ubi1:CBF3, Ubi1:ABF3, and NC plants. Plants grown in the greenhouse during the same time course shown in A were harvested and fresh and dry weight/10 plants measured. Each data point represents the mean ± sd of triplicate experiments with three different transgenic lines.
Figure 2.
Figure 2.
Growth characteristics of Ubi1:CBF3 and Ubi1:ABF3 plants. A, Growth phenotypes of 3 independent T4 homozygous lines for Ubi1:CBF3, Ubi1:ABF3, and NC plants at indicated days after germination (DAG). B, Dry weight and fresh weight accumulation of Ubi1:CBF3, Ubi1:ABF3, and NC plants. Plants grown in the greenhouse during the same time course shown in A were harvested and fresh and dry weight/10 plants measured. Each data point represents the mean ± sd of triplicate experiments with three different transgenic lines.
Figure 3.
Figure 3.
Appearance of plants and changes in chlorophyll fluorescence during drought stress. A, Four and three independent T4 homozygous lines for Ubi1:CBF3 and Ubi1:ABF3, respectively, and NC seedlings were grown in the greenhouse for 4 weeks and then subjected to 4 d of drought stress followed by 5 to 7 d of watering. Eighteen plants per each line were tested. Photos were taken at 1- or 2-d intervals; + followed by number denotes days of watering. B, Fv/Fm of the transgenic and NC plants in the same time course of drought stress shown in A was measured using a pulse modulation fluorometer (mini-PAM). Fv/Fm is a measure of accumulated photooxidative damage to PSII. Each data point represents the mean ± se of triplicate experiments (n = 6).
Figure 3.
Figure 3.
Appearance of plants and changes in chlorophyll fluorescence during drought stress. A, Four and three independent T4 homozygous lines for Ubi1:CBF3 and Ubi1:ABF3, respectively, and NC seedlings were grown in the greenhouse for 4 weeks and then subjected to 4 d of drought stress followed by 5 to 7 d of watering. Eighteen plants per each line were tested. Photos were taken at 1- or 2-d intervals; + followed by number denotes days of watering. B, Fv/Fm of the transgenic and NC plants in the same time course of drought stress shown in A was measured using a pulse modulation fluorometer (mini-PAM). Fv/Fm is a measure of accumulated photooxidative damage to PSII. Each data point represents the mean ± se of triplicate experiments (n = 6).
Figure 4.
Figure 4.
Changes in chlorophyll fluorescence during drought, high-salinity, and low-temperature stresses. Three independent T4 homozygous lines for Ubi1:CBF3, Ubi1:ABF3, and NC seedlings grown in the greenhouse for 14 d were subjected to various stress conditions as described: for drought stress, the seedlings were air-dried for 2 h at 28°C and for high-salinity stress seedlings were exposed to 400 mm NaCl for 2 h at 28°C. For low-temperature stress, they were exposed to 4°C for 6 h. All of the experiments were carried out under continuous light of 150 μmol m−2 s−1. Each data point represents the mean ± se of triplicate experiments (n = 6).
Figure 5.
Figure 5.
Induction of stress-related genes in Ubi1:CBF3 and Ubi1:ABF3 plants. Three independent T4 homozygous lines for Ubi1:CBF3, Ubi1:ABF3, and NC seedlings were grown in the greenhouse for 14 d. Transgenic and NC plants were then treated for 2 h with drought (the seedlings excised before being air-dried for 2 h), high salinity (400 mm NaCl) at the greenhouse, and with low-temperature stress (4°C) at the cold chamber under continuous light of 150 μmol m−2 s−1. For ABA treatments, 100 μm ABA was applied to each 14-d-old seedling for 2 h. RNA gel blots of total RNAs from transgenic and NC plants grown either under normal growth conditions (left) and under stress conditions (right) are indicated. RNA gel blots of NC plants grown under normal growth conditions were included on the left-hand side of each section for clarity of comparison. The blots were hybridized with probes for CBF3, ABF3, Lip5 (AB011368), Dip1 (AY587109), Jacalin1 (AK066682), Jacalin2 (AK101991), LOX (AJ270938), PSLS (AK072958), Hsp70 (CF280418), PP2Ca (CF304401), Wsi18 (D26536), Rab21 (Y00842), LEA4 (AK107930), PP2Cb (AK069274), and RbcS (Kyozuka et al., 1993). EtBr staining of total RNA was used to ensure equal RNA loading.
Figure 6.
Figure 6.
Transactivation of the Wsi18:GUS fusion by ABF3. The Wsi18:GUS construct was cotransformed with the effector constructs, either Ubi1:CBF3 or Ubi1:ABF3, or with the expression vector alone; 4 μg of each construct with 2 μg of Ubi1:LUC as an internal standard was used in all cases. Each bar represents the mean value of the relative GUS/LUC activities from four independent experiments.

References

    1. Artus NN, Uemura M, Steponkus PL, Gilmour SJ, Lin C, Thomashow MF (1996) Constitutive expression of the cold-regulated Arabidopsis thaliana COR15a gene affects both chloroplast and protoplast freezing tolerance. Proc Natl Acad Sci USA 93: 13404–13409 - PMC - PubMed
    1. Baker SS, Wilhelm KS, Thomashow MF (1994) The 5′-region of Arabidopsis thaliana cor15a has cis-acting elements that confer cold-, drought- and ABA-regulated gene expression. Plant Mol Biol 24: 1–13 - PubMed
    1. Bray EA (1997) Plant responses to water deficit. Trends Plant Sci 2: 48–54
    1. Busk PK, Jensen AB, Pages M (1997) Regulatory elements in vivo in the promoter of the abscisic acid responsive gene rab17 from maize. Plant J 11: 1285–1295 - PubMed
    1. Choi HI, Hong JH, Ha JO, Kang JY, Kim SY (2000) ABFs, a family of ABA-responsive element binding factors. J Biol Chem 275: 1723–1730 - PubMed

Publication types