

Chronic aeroallergen during infancy enhances eotaxin-3 expression in airway epithelium and nerves
- PMID: 15834047
- PMCID: PMC2715301
- DOI: 10.1165/rcmb.2004-0236RC
Chronic aeroallergen during infancy enhances eotaxin-3 expression in airway epithelium and nerves
Abstract
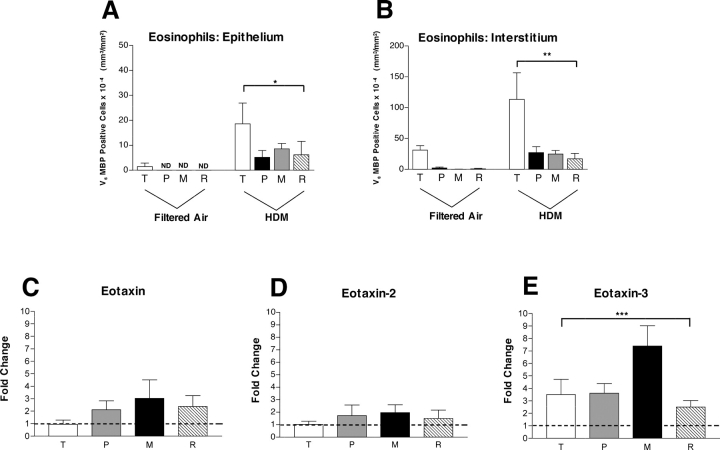
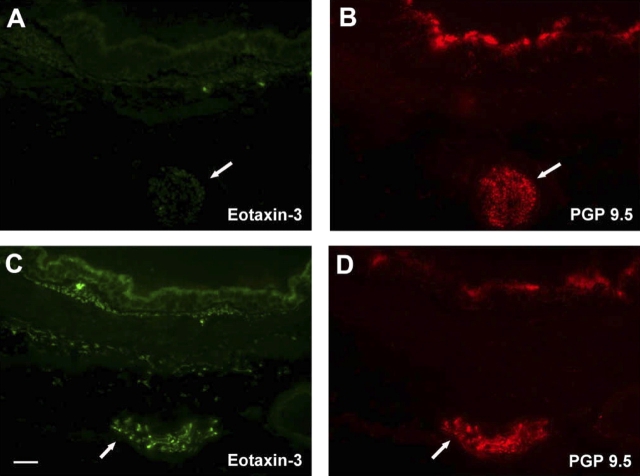
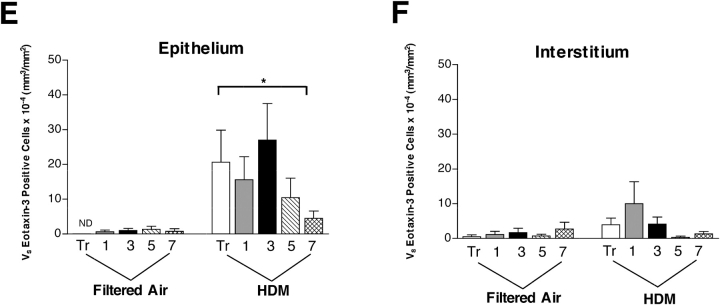
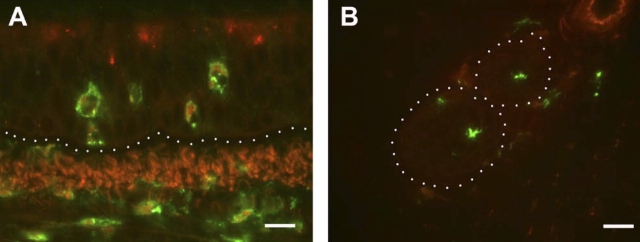
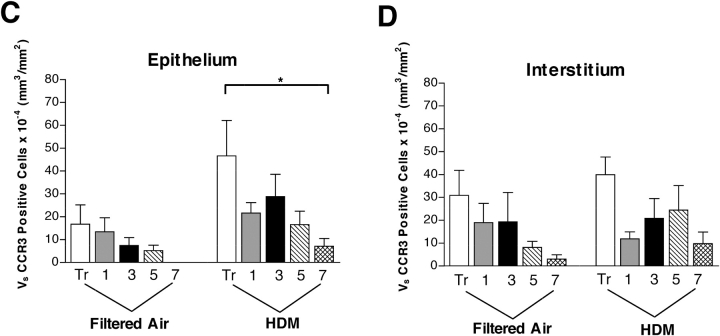
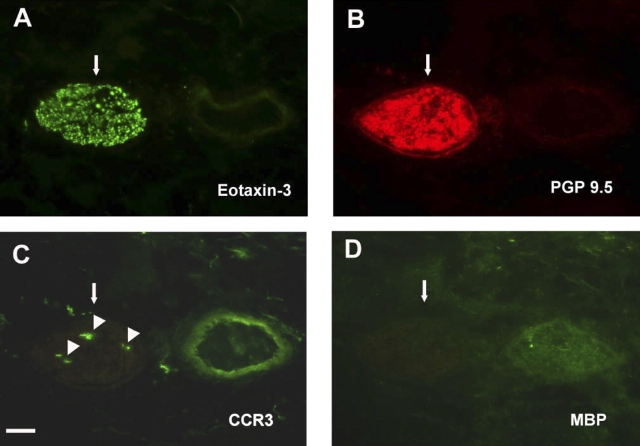
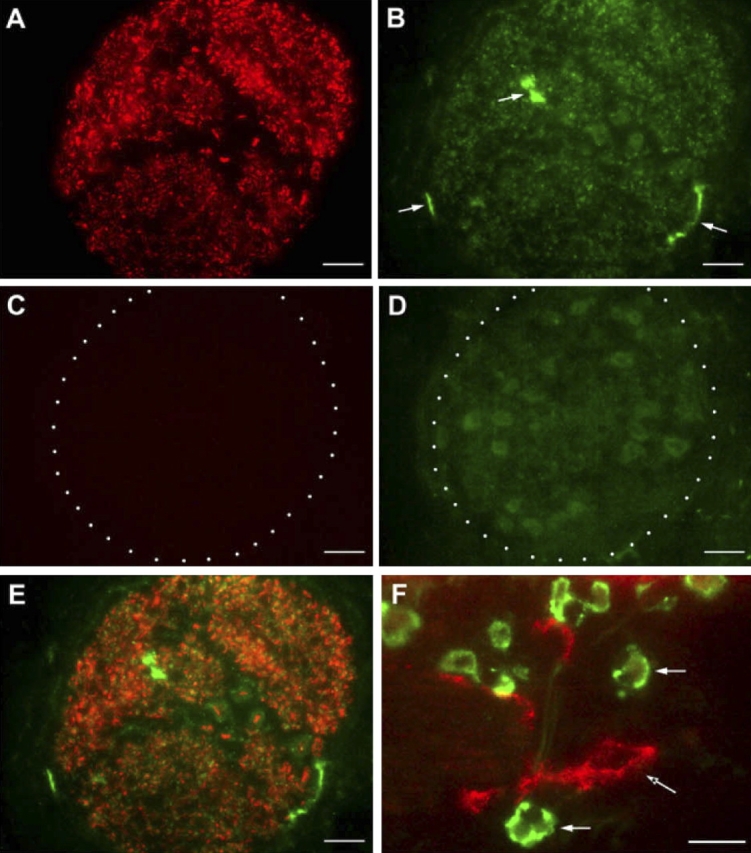
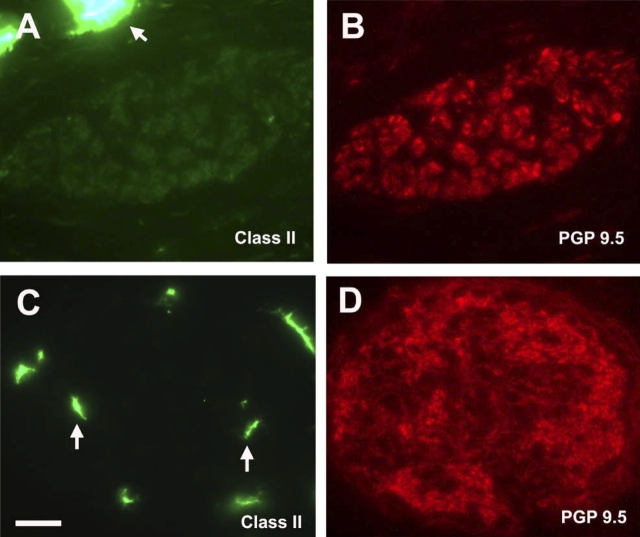
We have documented that exposure of rhesus monkeys to house dust mite aeroallergen during postnatal development resulted in significant recruitment of eosinophils into the airway mucosa (Clin Exp Allergy 33:1686-1694, 2003). Because eosinophils were not uniformly distributed throughout the five conducting airway generations examined, we speculated that trafficking within anatomic microenvironments of the lung is mediated by differential chemokine expression. To address this question, we used quantitative real-time RT-PCR to evaluate the related eosinophilic chemokines, eotaxin (CCL11), eotaxin-2 (CCL24), and eotaxin-3 (CCL26) within isolated airways of infant monkey lung. Overall, chemokine mRNA expression levels in house dust mite-exposed airways were as follows: eotaxin-3 > eotaxin > eotaxin-2. Immunofluorescence staining for eotaxin-3 and CC chemokine receptor 3 (CCR3) showed positive cells within epithelium and peripherally located nerve fiber bundles of the airway wall. Epithelial volume of eotaxin-3 within the trachea correlated with epithelial volume of major basic protein. CCR3+ and MHC Class II+ dendritic cells, but not eosinophils or mast cells, co-localized within eotaxin-3+ nerve fiber bundles. We conclude that localized expression of eotaxin-3 plays an important role in the recruitment of diverse CCR3+ cell populations to different anatomic microenvironments within the infant airway in response to chronic allergen exposure.
Figures
Similar articles
-
Increased CCL24/eotaxin-2 with postnatal ozone exposure in allergen-sensitized infant monkeys is not associated with recruitment of eosinophils to airway mucosa.Toxicol Appl Pharmacol. 2011 Dec 15;257(3):309-18. doi: 10.1016/j.taap.2011.09.001. Epub 2011 Sep 12. Toxicol Appl Pharmacol. 2011. PMID: 21945493 Free PMC article.
-
Cytokine-stimulated human lung alveolar epithelial cells release eotaxin-2 (CCL24) and eotaxin-3 (CCL26).J Interferon Cytokine Res. 2005 Feb;25(2):82-91. doi: 10.1089/jir.2005.25.82. J Interferon Cytokine Res. 2005. PMID: 15695929
-
CCL26/eotaxin-3 is more effective to induce the migration of eosinophils of asthmatics than CCL11/eotaxin-1 and CCL24/eotaxin-2.J Leukoc Biol. 2013 Aug;94(2):213-22. doi: 10.1189/jlb.0212074. Epub 2013 Mar 26. J Leukoc Biol. 2013. PMID: 23532518
-
Eotaxins and CCR3 receptor in inflammatory and allergic skin diseases: therapeutical implications.Curr Drug Targets Inflamm Allergy. 2003 Mar;2(1):81-94. doi: 10.2174/1568010033344480. Curr Drug Targets Inflamm Allergy. 2003. PMID: 14561178 Review.
-
[Role of eotaxin in the pathophysiology of asthma].Pneumonol Alergol Pol. 2007;75(2):180-5. Pneumonol Alergol Pol. 2007. PMID: 17973226 Review. Polish.
Cited by
-
Airway mast cells in a rhesus model of childhood allergic airways disease.Toxicol Sci. 2010 Jul;116(1):313-22. doi: 10.1093/toxsci/kfq119. Epub 2010 Apr 19. Toxicol Sci. 2010. PMID: 20403968 Free PMC article.
-
Nonhuman primate models of asthma.J Exp Med. 2005 Jun 20;201(12):1875-9. doi: 10.1084/jem.20050901. J Exp Med. 2005. PMID: 15967818 Free PMC article.
-
Neuronal eotaxin and the effects of CCR3 antagonist on airway hyperreactivity and M2 receptor dysfunction.J Clin Invest. 2006 Jan;116(1):228-36. doi: 10.1172/JCI25423. Epub 2005 Dec 22. J Clin Invest. 2006. PMID: 16374515 Free PMC article.
-
Lung effects of inhaled corticosteroids in a rhesus monkey model of childhood asthma.Clin Exp Allergy. 2012 Jul;42(7):1104-18. doi: 10.1111/j.1365-2222.2012.04005.x. Clin Exp Allergy. 2012. PMID: 22702509 Free PMC article.
-
Increased CCL24/eotaxin-2 with postnatal ozone exposure in allergen-sensitized infant monkeys is not associated with recruitment of eosinophils to airway mucosa.Toxicol Appl Pharmacol. 2011 Dec 15;257(3):309-18. doi: 10.1016/j.taap.2011.09.001. Epub 2011 Sep 12. Toxicol Appl Pharmacol. 2011. PMID: 21945493 Free PMC article.
References
-
- Wardlaw AJ, Dunnette S, Gleich GJ, Collins JV, Kay AB. Eosinophils and mast cells in bronchoalveolar lavage in subjects with mild asthma: relationship to bronchial hyperreactivity. Am Rev Respir Dis 1988;137:62–69. - PubMed
-
- Kay AB, Menzies-Gow A. Eosinophils and interleukin-5: the debate continues. Am J Respir Crit Care Med 2003;167:1586–1587. - PubMed
-
- Wills-Karp M. Immunologic basis of antigen-induced airway hyperresponsiveness. Annu Rev Immunol 1999;17:255–281. - PubMed
-
- Mauser PJ, Pitman AM, Fernandez X, Foran SK, Adams GK, Kreutner W, Egan RW, Chapman RW. Effects of an antibody to interleukin-5 in a monkey model of asthma. Am J Respir Crit Care Med 1995;152:467–472. - PubMed
-
- Hamelmann E, Oshiba A, Schwarze J, Bradley K, Loader J, Larsen GL, Gelfand EW. Allergen-specific IgE and IL-5 are essential for the development of airway hyperresponsiveness. Am J Respir Cell Mol Biol 1997;16:674–682. - PubMed
Publication types
MeSH terms
Substances
Grants and funding
LinkOut - more resources
Full Text Sources
Research Materials
