. 2005 Jul;46(7):1548-60.
doi: 10.1194/jlr.D500007-JLR200. Epub 2005 Apr 16.

Shotgun lipidomics of phosphoethanolamine-containing lipids in biological samples after one-step in situ derivatization

Affiliations

Shotgun lipidomics of phosphoethanolamine-containing lipids in biological samples after one-step in situ derivatization

Xianlin Han et al. J Lipid Res. 2005 Jul.

Abstract

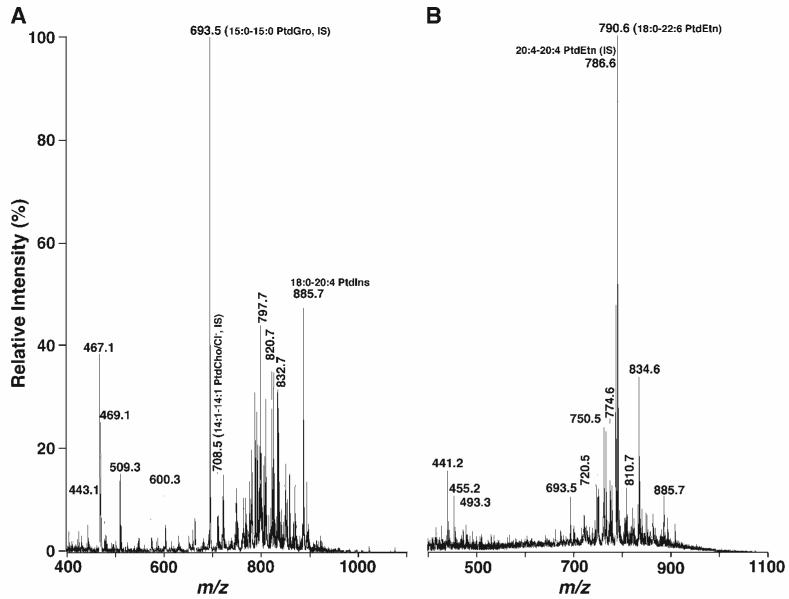
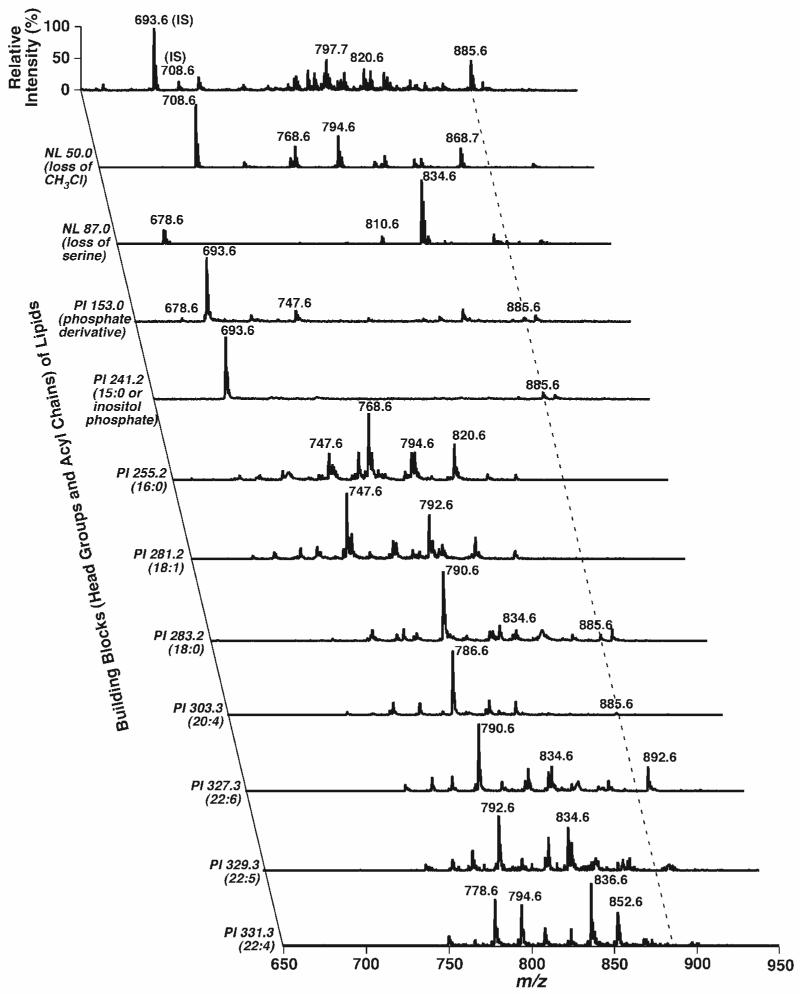
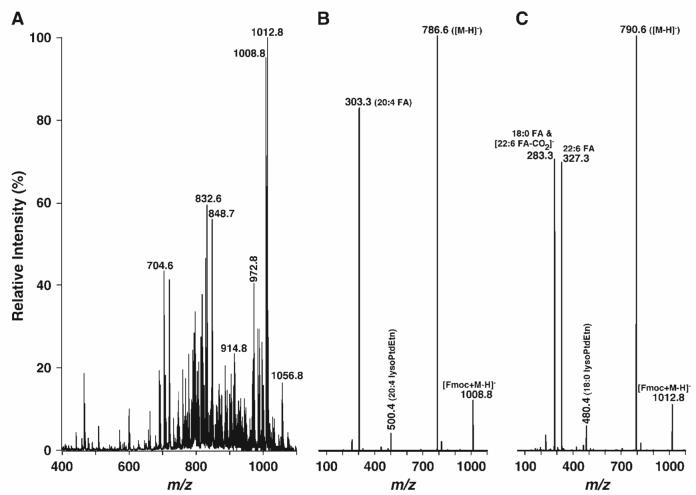
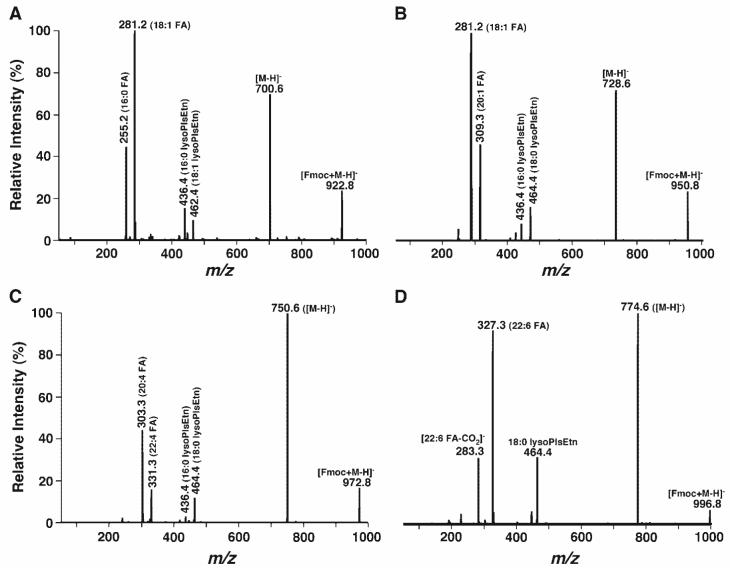
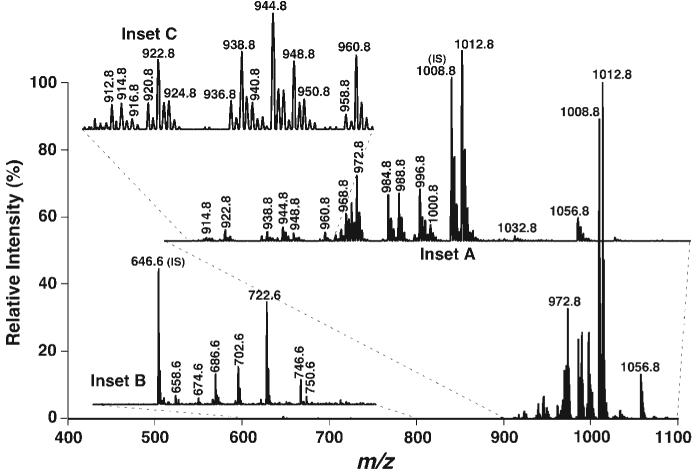
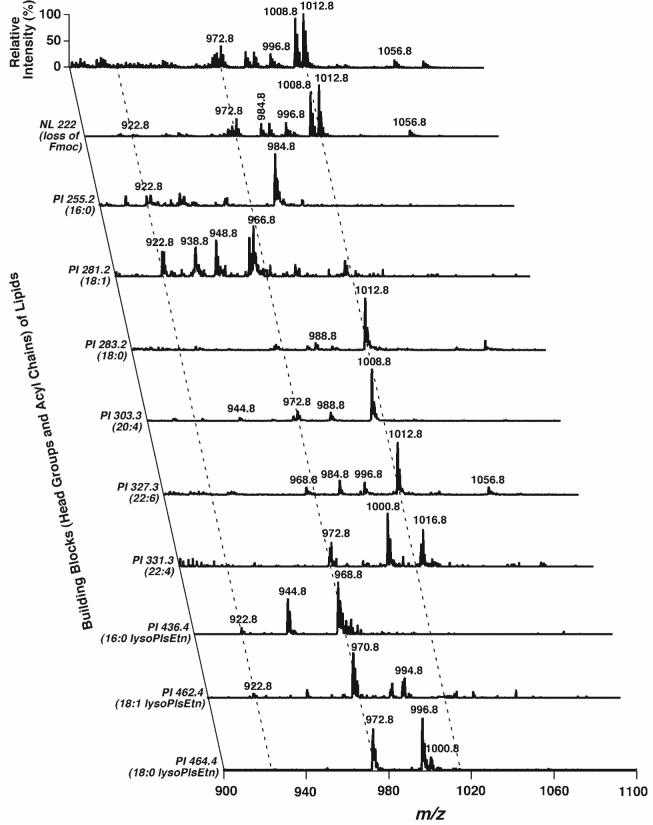
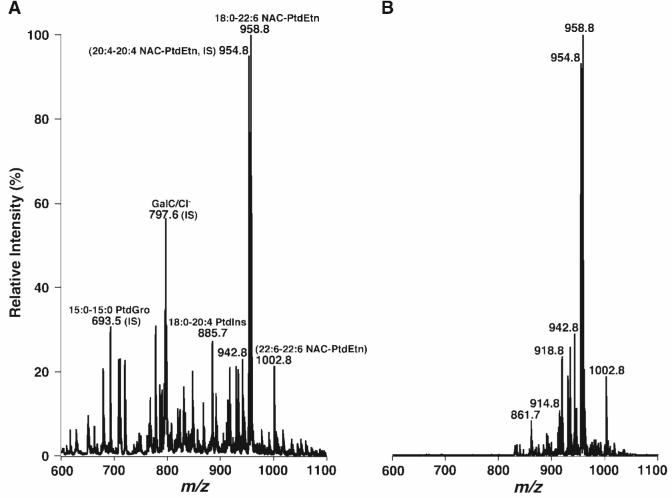
This article presents a novel methodology for the analysis of ethanolamine glycerophospholipid (PE) and lysoPE molecular species directly from lipid extracts of biological samples. Through brief treatment of lipid extracts with fluorenylmethoxylcarbonyl (Fmoc) chloride, PE and lysoPE species were selectively derivatized to their corresponding carbamates. The reaction solution was infused directly into the ion source of an electrospray ionization mass spectrometer after appropriate dilution. The facile loss of the Fmoc moiety dramatically enhanced the analytic sensitivity and allowed the identification and quantitation of low-abundance molecular species. A detection limitation of attomoles (amoles) per microliter for PE and lysoPE analysis was readily achieved using this technique (at least a 100-fold improvement from our previous method) with a >15,000-fold dynamic range. Through intrasource separation and multidimensional mass spectrometry array analysis of derivatized species, marked improvements in signal-to-noise ratio, molecular species identification, and quantitation can be realized. The procedure is both simple and effective and can be extended to analyze many other lipid classes or other cellular metabolites by adjustments in specific derivatization conditions. Thus, through judicious derivatization, a new dimension exploiting specific functional reactivities in each lipid class can be used in conjunction with shotgun lipidomics to penetrate farther into the low-abundance regime of cellular lipidomes.


Figures

Fig. 1
Fig. 1
Representative negative ion electrospray ionization-mass spectrometry (ESI-MS) spectra of a lipid extract from mouse retinas. Mouse retina lipid extracts were prepared by a modified method of Bligh and Dyer (24) as described in Materials and Methods. ESI mass spectra were acquired in negative ion mode by direct infusion of lipid solution after dilution to a total lipid concentration of ∼50 pmol/μl with 1:1 chloroform-methanol (v/v) (A) or from the identical diluted lipid solution after the addition of 50 nmol LiOH/mg protein (B). The indicated molecular species were identified by two-dimensional (2D) MS (see Fig. 2). IS, internal standard; PtdCho, phosphatidylcholine; PtdEtn, phosphatidylethanolamine; PtdGro, phosphatidylglycerol; PtdIns, phosphatidylinositol.
Fig. 2
Fig. 2
Representative 2D ESI mass spectra of a chloroform extract of mouse retinas in negative ion mode. A conventional ESI mass spectrum was acquired in the negative ion mode directly from a diluted mouse retina lipid extract (see Fig. 1A) before analysis of lipid building blocks in the second dimension by precursor ion (PI) scanning and neutral loss (NL) scanning as indicated. Each mass spectral scan was acquired as described previously (4). All mass spectral traces were displayed after normalization to the base peak in each spectrum. IS, internal standard; m:n, acyl chain containing m carbons and n double bonds.
Fig. 3
Fig. 3
Representative negative ion ESI-MS and product ion ESI mass spectra of a lipid extract of mouse retinas after derivatization with fluorenylmethoxylcarbonyl chloride (Fmoc-Cl). An appropriate amount of Fmoc-Cl in anhydrous chloroform was added to the identical mouse retina lipid extract used in Fig. 1 in a ratio of 1:1 [Fmoc-Cl to ethanolamine glycerophospholipid (PE) content in the extract]. The mixture was incubated at room temperature for 5 min and diluted directly with 1:1 chloroform-methanol to a concentration of ∼50 pmol/μl total lipids. The negative ion ESI mass spectrum (A) was acquired as described in Materials and Methods. Product ion ESI-MS analyses of Fmoc-derivatized pseudomolecular ions at m/z 1008.8 (B) and 1012.8 (C) as shown in A were performed by selection of the pseudomolecular ion in the first quadrupole, collision activation in the second quadrupole with a collision energy of 30 eV and gas pressure of 1 mTorr, and analysis of the resulting product ions in the third quadrupole.
Fig. 4
Fig. 4
Product ion ESI-MS analyses of Fmoc-derivatized plasmenylethanolamine (PlsEtn) molecular species in the lipid extracts of mouse retinas. PlsEtn molecular species were identified by treatment of the mouse retina lipid extracts with acidic vapor, under which these species disappeared. Product ion ESI-MS analyses of Fmoc-derivatized pseudo-PlsEtn molecular ions at m/z 922.8 (A), 950.8 (B), 972.8 (C), and 996.8 (D) in the ESI mass spectrum of Fmoc-PE (Fig. 3A) were performed as described in the legend to Fig. 3. The presence of both fatty acyl carboxylates and lysoPlsEtn ions indicated the structures of Fmoc-PlsEtn.
Fig. 5
Fig. 5
Tandem mass spectrum of Fmoc-derivatized phosphoethanolamine-containing lipids by NL of the Fmoc moiety. Phosphoethanolamine-containing species were derivatized by the addition of an equimolar amount of Fmoc-Cl as described in the legend to Fig. 3. NL tandem mass spectra of Fmoc-PE (inset A) and Fmoc-lysoPE (inset B) were acquired by coordinately scanning both the first and third quadrupoles with a mass difference (i.e., NL) of 222.2 u, corresponding to the NL of a Fmoc moiety, while collision activation was performed in the second quadrupole at collision energy of 30 eV and collision gas pressure of 1 mTorr. Inset C indicates the presence of many very low-abundance PE molecular species in the region. IS, internal standard.
Fig. 6
Fig. 6
Representative 2D ESI mass spectra of Fmoc-PE of a chloroform extract of mouse retinas in the negative ion mode. A conventional ESI mass spectrum of Fmoc-PE was acquired in the negative ion mode directly from a diluted mouse retina lipid extract after derivatization with Fmoc-Cl (Fig. 3A) as described in the legend to Fig. 3. Analyses of Fmoc-PE building blocks in the second dimension, including the Fmoc moiety, fatty acyl carboxylates, and lysoPlsEtn ions by PI scanning and NL scanning, were performed as described in Materials and Methods. All mass spectral traces were displayed after normalization to the base peak in each spectrum.
Fig. 7
Fig. 7
Representative negative ion ESI-MS and NL mass spectra of 2-(2-naphthyl)acetyl chloride (NAC)-derivatized PE molecular species of mouse retina lipid extracts. An appropriate amount of NAC in anhydrous chloroform was added to the identical mouse retina lipid extract used in Fig. 1 in a molar ratio of 1:1 (NAC to PE content in the extract). The mixture was incubated at room temperature for 30 min and diluted directly with 1:1 chloroform-methanol to a concentration of ∼50 pmol/μl total lipids. The negative ion ESI mass spectrum (A) was acquired as described in Materials and Methods. The NL tandem mass spectrum of NAC-derivatized PE molecular species (B) was acquired by coordinately scanning both the first and third quadrupoles with a mass difference (i.e., NL) of 168.2 u, corresponding to the NL of a 2-(2-naphthyl)acetyl moiety, while collision activation was performed in the second quadrupole at collision energy of 40 eV and collision gas pressure of 1 mTorr. IS, internal standard.

References

    1. Han X, Gross RW. Global analyses of cellular lipidomes directly from crude extracts of biological samples by ESI mass spectrometry: a bridge to lipidomics. J. Lipid Res. 2003;44:1071–1079. - PubMed
    1. Han X, Gross RW. Shotgun lipidomics: electrospray ionization mass spectrometric analysis and quantitation of the cellular lipidomes directly from crude extracts of biological samples. Mass Spectrom. Rev. 2005;24:367–412. - PubMed
    1. Han X, Gross RW. Shotgun lipidomics: multi-dimensional mass spectrometric analysis of cellular lipidomes. Expert Rev. Proteomics. 2005;2:253–264. - PubMed
    1. Han X, Yang J, Cheng H, Ye H, Gross RW. Towards fingerprinting cellular lipidomes directly from biological samples by two-dimensional electrospray ionization mass spectrometry. Anal. Biochem. 2004;330:317–331. - PubMed
    1. Tang L, Kebarle P. Effect of the conductivity of the electrosprayed solution on the electrospray current. Factors determining analyte sensitivity in electrospray mass spectrometry. Anal. Chem. 1991;63:2709–2715.

Publication types

LinkOut - more resources