Comparative Study
. 2005 May;15(5):681-91.
doi: 10.1101/gr.3216905. Epub 2005 Apr 18.

Cis-acting expression quantitative trait loci in mice

Affiliations
Comparative Study

Cis-acting expression quantitative trait loci in mice

Sudheer Doss et al. Genome Res. 2005 May.

Abstract

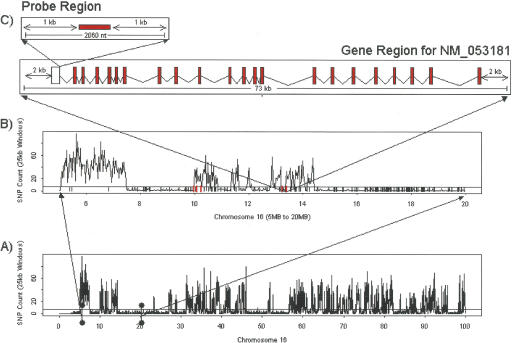
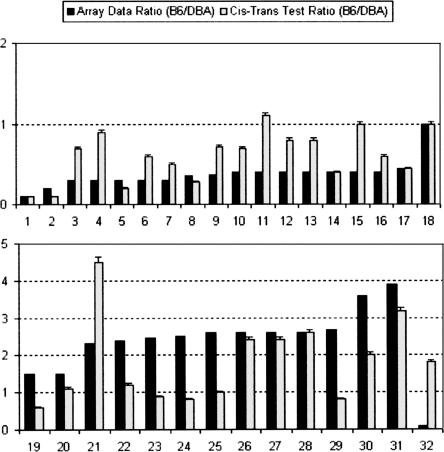
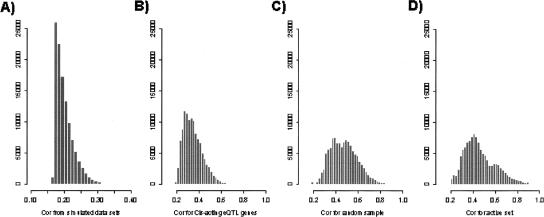
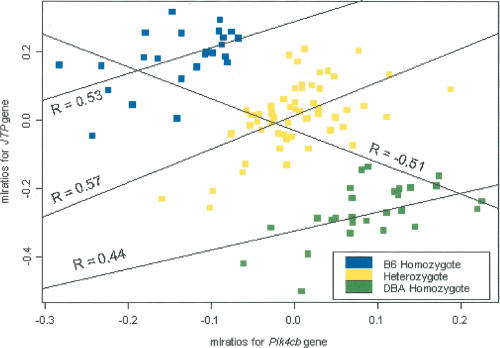
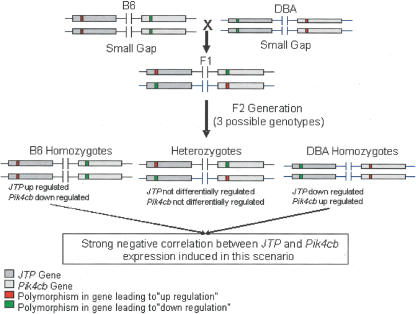
We previously reported the analysis of genome-wide expression profiles and various diabetes-related traits in a segregating cross between inbred mouse strains C57BL/6J (B6) and DBA/2J (DBA). By considering transcript levels as quantitative traits, we identified several thousand expression quantitative trait loci (eQTL) with LOD score >4.3. We now experimentally address the problem of multiple comparisons by estimating the fraction of false-positive eQTL that are under cis-acting regulation. For this, we have utilized a classic cis-trans test with (B6 x DBA)F(1) mice to determine the relative levels of transcripts from the B6 and DBA alleles. The results suggest that at least 64% of cis-acting eQTL with LOD >4.3 are true positives, while the remaining 36% could not be confirmed as truly cis-acting. Moreover, we find that >96% of apparent cis-acting eQTL occur in regions that do not share SNP haplotypes. Cis-acting eQTL serve as an important new resource for the identification of positional candidates in QTL studies in mice. Also, we use the analysis of the correlation structures between genotypes, gene expression traits, and phenotypic traits to further characterize genes expressed in liver that are under cis-acting control, and highlight the advantages and disadvantages of integrating genetics and gene expression data in segregating populations.


Figures

Figure 1.
Figure 1.
Informative SNP frequency across chromosome 16 between B6 and DBA. The horizontal line in graphs A and B represents the threshold of five SNP/25 kb. Regions with five or less SNPs in a 25-kb interval were designated IBD between B6 and DBA. (A) The entire chromosome 16; (B) a closer look at an ∼15-Mb region on proximal chromosome 16, where the small vertical red lines at the base of the figure represent genes with cis eQTL in this region. (C) further zooms in on NM_053181, depicting the boundaries for the various regions considered in the SNP overlapping probe analysis.
Figure 2.
Figure 2.
Results of cistrans test on a subset of cis-acting eQTLs. See Table 1 for GenBank accession numbers corresponding to gene numbers. Black bars indicate B6:DBA ratio observed in previously described microarray data (Schadt et al. 2003). Light gray bars indicate the observed ratio from the cistrans test and are displayed with standard error bars. A total of 19 of 29 genes confirm the mode of regulation observed in the microarray data according to our definition described in the text.
Figure 3.
Figure 3.
Significant differences in the distribution of Pearson correlation coefficients involving genes with strong cis-acting eQTL versus genes with weak or no cis-acting eQTL. For each gene considered, the Pearson correlation coefficient was computed between the ml ratio vector for the gene from the BXD population and the ml ratio vectors for every other gene monitored in the BXD population (23,472 genes), resulting in a correlation vector for each gene. Histograms for the correlation coefficients whose significances fell in the ninth percentile were plotted in A–D for different sets of genes. (A) Distribution of correlations for 100 simulated mlratio vectors, representing the random distribution expected if 100 genes with independent mlratio vectors are compared with 23,472 other mlratio vectors assumed to be independent of the 100 simulated mlratio vectors. (B) Correlation distribution for the 100 genes with the strongest cis-acting eQTL in the BXD data set; all cis-acting eQTL in this set had LOD scores >15. (C) Correlation coefficient distribution for 100 genes randomly chosen from the set of 23,500 genes represented on the microarray in the BXD set. (D) Correlation coefficient distribution for 100 genes randomly chosen from the set of most transcriptionally active genes in the BXD set.
Figure 4.
Figure 4.
Scatter plot of the mlratios for the jumping translocation point (JTP) and phosphatidylinositol 4-kinase, catalytic, β polypeptide (Pik4cb) genes in the BXD set. Color coding of each point is given with respect to the genotypes at a locus coincident with the physical location of the JTP and Pik4cb genes (the grouping indicates strong cis-acting eQTL for each gene). The overall correlation is computed to be –0.51, a statistically significant correlation (P = 7.8 × 10⁻⁹). The correlation within each genotype group is seen to be statistically significant as well, with a correlation of 0.53 in the B6 group, a correlation of 0.57 in the heterozygote group, and a correlation of 0.44 in the DBA group. Interestingly, the overall correlation is opposite in sign to each of the within-group correlations.
Figure 5.
Figure 5.
Diagram explaining the overall negative correlation observed in Figure 3.
Figure 6.
Figure 6.
Highlighting what may be the biologically relevant component of the correlation between the JTP and Pik4cb gene-expression traits. This scatter plot represents the correlation between the JTP and Pik4cb gene-expression traits conditional on the locus at the JTP and Pik4cb gene locations. The overall correlation in this instance is now significantly positive, almost identical to the overall correlation given in Figure 4, but opposite in sign. Using the overall correlation statistic between these two traits as shown in Figure 4 completely obscures this relationship.
Figure 7.
Figure 7.
Utilization of genetics of gene expression data in order to prioritize candidate genes underlying a locus of interest. A cQTL for chow diet total cholesterol levels was previously described on chromosome 3 at 24 cM at the peak marker D3mit241 (Drake et al. 2001; Colinayo et al. 2003). Cis-acting eQTL were identified as transcripts that mapped to the cQTL peak marker or either of the markers flanking this marker with a LOD score >4.3, and physically reside within 20 cM of the peak marker. This resulted in a candidate gene list of 11 genes. The LOD score curve for cholesterol (blue) is shown in relation to those for each of 11 candidate cis eQTLs (black). GenBank accession numbers for the candidate genes are indicated in the corner of each plot.
Figure 8.
Figure 8.
Genes with eQTL that are coincident with the physical location of the 1810073K19Rik gene test as reactive to the strong cis-acting 1810073K19Rik gene-expression perturbation, providing direct support that this cluster of eQTL obtains in response to the 1810073K19Rik perturbation. (A) The list of genes linking to the chromosome 7 locus. Only 1810073K19Rik has its physical location coincident with this locus. (B) Graph supported by examining the correlation structures between the gene-expression traits and locus using the causality test (E.E. Schadt, J. Lamb, X. Yang, J. Zhu, S. Edwards, D. GuhaThukarta, S.K. Sieberts, S. Monks, M. Reitman, C. Zhang, et al., in prep.; Zhu et al. 2004).

References

    1. Abiola, O., Angel, J.M., Avner, P., Bachmanov, A.A., Belknap, J.K., Bennett, B., Blankenhorn, E.P., Blizard, D.A., Bolivar, V., Brockmann, G.A., et al. 2003. The nature and identification of quantitative trait loci: A community's view. Nat. Rev. Genet. 4: 911–916. - PMC - PubMed
    1. Altschul, S.F., Gish, W., Miller, W., Myers, E.W., and Lipman, D.J. 1990. J. Mol. Biol. 215: 403–410. - PubMed
    1. Brem, R.B., Yvert, G., Clinton, R., and Kruglyak, L. 2002. Genetic dissection of transcriptional regulation in budding yeast. Science 296: 752–755. - PubMed
    1. Chesler, E.J., Wang, J., Lu, L., Qu, Y., Manly, K.F., and Williams, R.W. 2003. Genetic correlates of gene expression in recombinant inbred strains: A relational model system to explore neurobehavioral phenotypes. Neuroinformatics 1: 343–357. - PubMed
    1. Colinayo, V.V., Qiao, J.H., Wang, X., Krass, K.L., Schadt, E., Lusis, A.J., and Drake, T.A. 2003. Genetic loci for diet-induced atherosclerotic lesions and plasma lipids in mice. Mammalian Genome 14: 464–471. - PubMed

Web site references

    1. http://www.pyrosequencing.com; Pyrosequencing SNP primer design software v1.0.1.

Publication types