

Analysis of long-lived C. elegans daf-2 mutants using serial analysis of gene expression
- PMID: 15837805
- PMCID: PMC1088289
- DOI: 10.1101/gr.3274805
Analysis of long-lived C. elegans daf-2 mutants using serial analysis of gene expression
Abstract
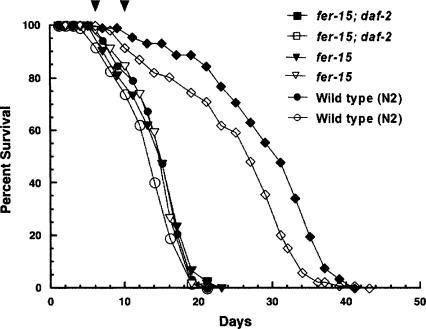
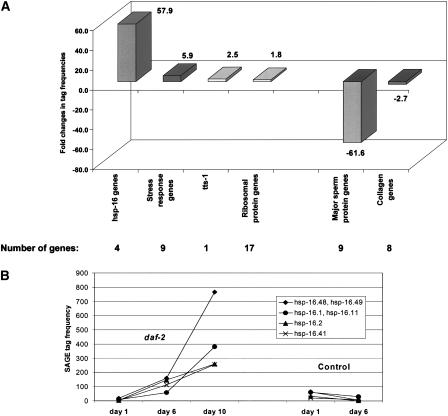
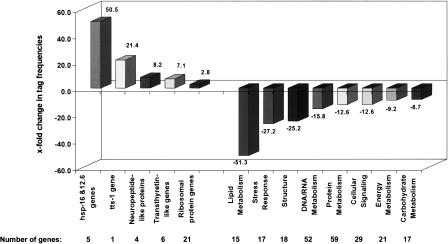
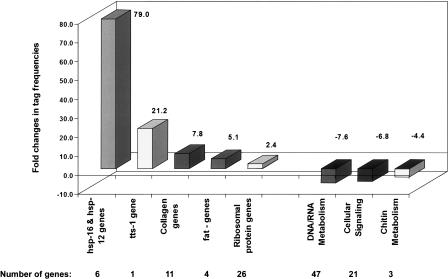
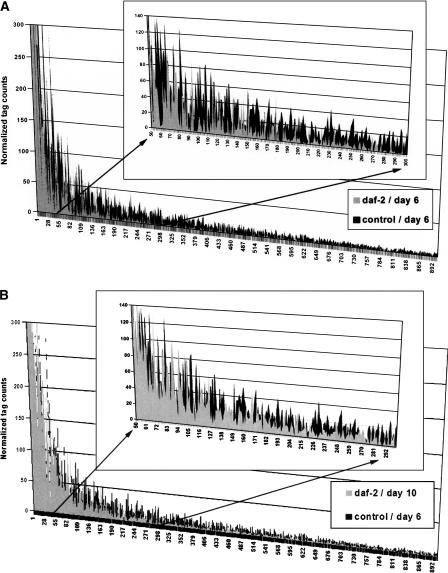
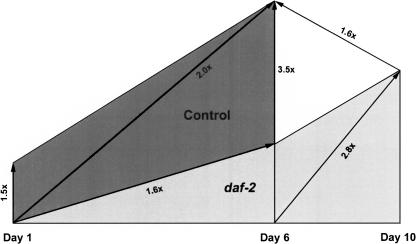
We have identified longevity-associated genes in a long-lived Caenorhabditis elegans daf-2 (insulin/IGF receptor) mutant using serial analysis of gene expression (SAGE), a method that efficiently quantifies large numbers of mRNA transcripts by sequencing short tags. Reduction of daf-2 signaling in these mutant worms leads to a doubling in mean lifespan. We prepared C. elegans SAGE libraries from 1, 6, and 10-d-old adult daf-2 and from 1 and 6-d-old control adults. Differences in gene expression between daf-2 libraries representing different ages and between daf-2 versus control libraries identified not only single genes, but whole gene families that were differentially regulated. These gene families are part of major metabolic pathways including lipid, protein, and energy metabolism, stress response, and cell structure. Similar expression patterns of closely related family members emphasize the importance of these genes in aging-related processes. Global analysis of metabolism-associated genes showed hypometabolic features in mid-life daf-2 mutants that diminish with advanced age. Comparison of our results to recent microarray studies highlights sets of overlapping genes that are highly conserved throughout evolution and thus represent strong candidate genes that control aging and longevity.
Figures
Similar articles
-
End-of-life targeted degradation of DAF-2 insulin/IGF-1 receptor promotes longevity free from growth-related pathologies.Elife. 2021 Sep 10;10:e71335. doi: 10.7554/eLife.71335. Elife. 2021. PMID: 34505574 Free PMC article.
-
Erratum to "Diapause-associated metabolic traits reiterated in long-lived daf-2 mutants in the nematode Caenorhabditis elegans" [Mech. Ageing Dev. 127 (5) (2006) 458-472].Mech Ageing Dev. 2006 Dec;127(12):922-36. doi: 10.1016/j.mad.2006.10.002. Mech Ageing Dev. 2006. PMID: 17216712
-
Alternate metabolism during the dauer stage of the nematode Caenorhabditis elegans.Exp Gerontol. 2005 Nov;40(11):850-6. doi: 10.1016/j.exger.2005.09.006. Epub 2005 Oct 10. Exp Gerontol. 2005. PMID: 16221538 Review.
-
DAF-16-dependent and independent expression targets of DAF-2 insulin receptor-like pathway in Caenorhabditis elegans include FKBPs.J Mol Biol. 2001 Dec 14;314(5):1017-28. doi: 10.1006/jmbi.2000.5210. J Mol Biol. 2001. PMID: 11743719
-
The search for DAF-16/FOXO transcriptional targets: approaches and discoveries.Exp Gerontol. 2006 Oct;41(10):910-21. doi: 10.1016/j.exger.2006.06.040. Epub 2006 Aug 24. Exp Gerontol. 2006. PMID: 16934425 Review.
Cited by
-
Amyotrophic Lateral Sclerosis Mechanism: Insights from the Caenorhabditis elegans Models.Cells. 2024 Jan 3;13(1):99. doi: 10.3390/cells13010099. Cells. 2024. PMID: 38201303 Free PMC article. Review.
-
In vitro and in vivo defensive effect of probiotic LAB against Pseudomonas aeruginosa using Caenorhabditis elegans model.Virulence. 2018;9(1):1489-1507. doi: 10.1080/21505594.2018.1518088. Virulence. 2018. PMID: 30257614 Free PMC article.
-
Exposure to dexamethasone modifies transcriptomic responses of free-living stages of Strongyloides stercoralis.PLoS One. 2021 Jun 28;16(6):e0253701. doi: 10.1371/journal.pone.0253701. eCollection 2021. PLoS One. 2021. PMID: 34181669 Free PMC article.
-
PMK-1 p38 MAPK promotes cadmium stress resistance, the expression of SKN-1/Nrf and DAF-16 target genes, and protein biosynthesis in Caenorhabditis elegans.Mol Genet Genomics. 2017 Dec;292(6):1341-1361. doi: 10.1007/s00438-017-1351-z. Epub 2017 Aug 1. Mol Genet Genomics. 2017. PMID: 28766017 Free PMC article.
-
The 14-3-3 protein FTT-2 regulates DAF-16 in Caenorhabditis elegans.Dev Biol. 2007 Jan 1;301(1):82-91. doi: 10.1016/j.ydbio.2006.10.013. Epub 2006 Oct 14. Dev Biol. 2007. PMID: 17098225 Free PMC article.
References
-
- Arantes-Oliveira, N., Berman, J.R., and Kenyon, C. 2003. Healthy animals with extreme longevity. Science 302: 611. - PubMed
-
- Audic, S. and Claverie, J.M. 1997. The significance of digital gene expression profiles. Genome Res. 7: 986–995. - PubMed
-
- Bargmann, C.I. and Horvitz, H.R. 1991. Control of larval development by chemosensory neurons in Caenorhabditis elegans. Science 251: 1243–1246. - PubMed
Web site references
-
- http://www.wormbase.org/; WormBase, an annotated database for C. elegans genes, proteins, and genomic sequences.
-
- http://tock.bcgsc.bc.ca/cgi-bin/sage; Genome Sciences Centre, BC Cancer Agency, C. elegans SAGE analysis tool (multisage).
-
- http://elegans.bcgsc.ca/home/sage.html; Spreadsheets summarizing tag-to-gene mapping for all five libraries.
-
- http://www.bcgsc.ca/bioinfo/software/discoveryspace/; Discovery Space Software.
Publication types
MeSH terms
Substances
Grants and funding
LinkOut - more resources
Full Text Sources
Miscellaneous