Comparative Study
. 2005 Apr 18;201(8):1319-32.
doi: 10.1084/jem.20042558.

Natural selection drives recurrent formation of activating killer cell immunoglobulin-like receptor and Ly49 from inhibitory homologues

Affiliations
Comparative Study

Natural selection drives recurrent formation of activating killer cell immunoglobulin-like receptor and Ly49 from inhibitory homologues

Laurent Abi-Rached et al. J Exp Med. .

Abstract

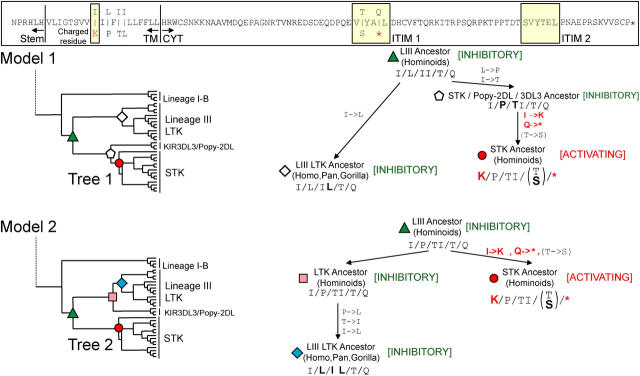
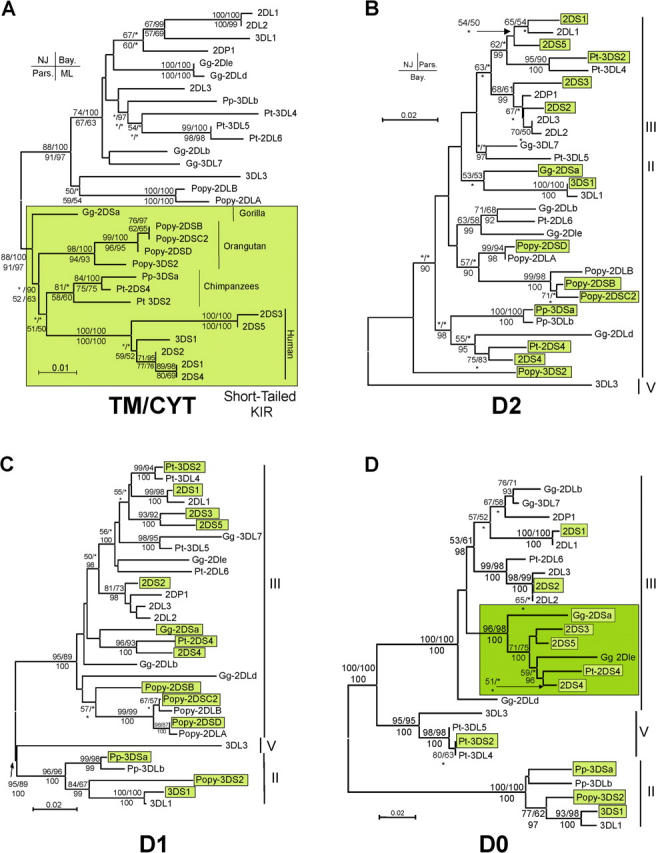
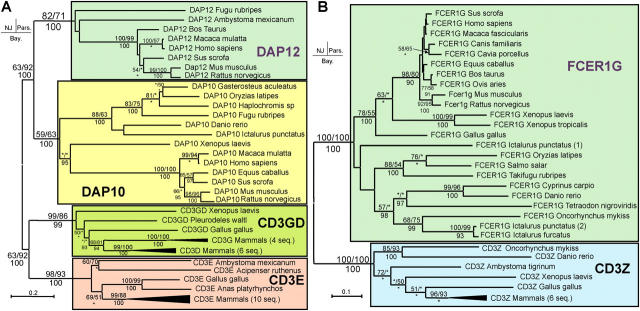
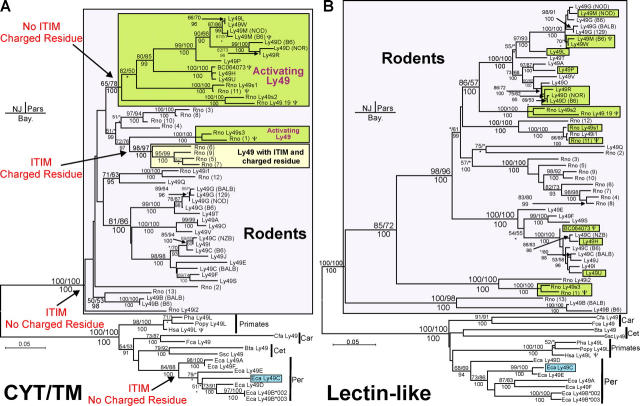
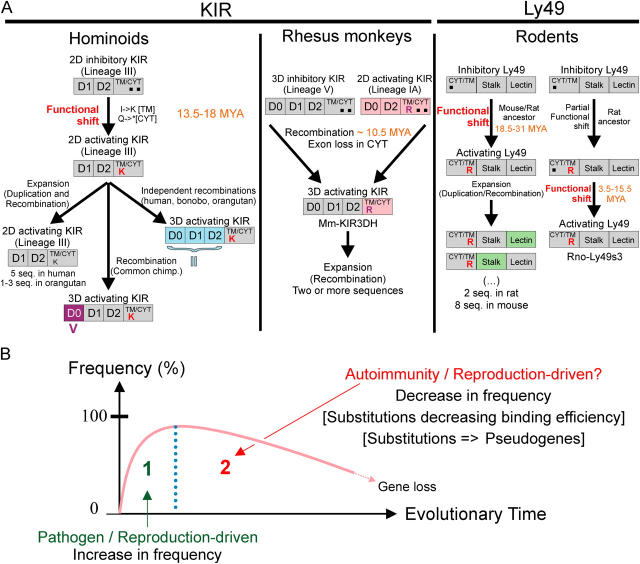
Expression of killer cell Ig-like receptors (KIRs) diversifies human natural killer cell populations and T cell subpopulations. Whereas the major histocompatibility complex class I binding functions of inhibitory KIR are known, specificities for the activating receptors have resisted analysis. To understand better activating KIR and their relationship to inhibitory KIR, we took the approach of reconstructing their natural history and that of Ly49, the analogous system in rodents. A general principle is that inhibitory receptors are ancestral, the activating receptors having evolved from them by mutation. This evolutionary process of functional switch occurs independently in different species to yield activating KIR and Ly49 genes with similar signaling domains. Selecting such convergent evolution were the signaling adaptors, which are older and more conserved than any KIR or Ly49. After functional shift, further activating receptors form through recombination and gene duplication. Activating receptors are short lived and evolved recurrently, showing they are subject to conflicting selections, consistent with activating KIR's association with resistance to infection, reproductive success, and susceptibility to autoimmunity. Our analysis suggests a two-stage model in which activating KIR or Ly49 are initially subject to positive selection that rapidly increases their frequency, followed by negative selection that decreases their frequency and leads eventually to loss.


Figures

Figure 1.
Figure 1.
The signaling domains of short-tailed hominoid KIR form a monophyletic group within lineage III KIR. (A) Comparison of mammalian KIR signaling domains shows that primate sequences form a monophyletic group. To simplify the tree, the primate sequences were collapsed. (B) Among primate KIR the signaling domains of short-tailed KIR form a monophyletic group within lineage III (B). Neighbor joining (NJ) and Bayesian trees gave statistically similar topologies; the NJ topology is displayed (using a midpoint rooting). Colored boxes denote the different KIR lineages. The statistical support for each node (expressed as a percentage) was given by the interior branch test confidence probability and the Bayesian posterior probability. Values are shown for nodes supported by ≥90% with one or both methods; asterisks indicate values <90%. Nodes marked by a filled circle were supported ≥95% by both methods. Gg, Gorilla gorilla; Mm, Macaca mulatta; Pt, Pan troglodytes; Pp, Pan paniscus, Popy, Pongo pygmaeus.
Figure 2.
Figure 2.
The STK ancestor evolved by functional switch of an inhibitory KIR. The signaling domain sequences of the STK, LTK, and lineage III ancestors were reconstructed. The upper panel shows the amino acid sequence. Residues common to the different predictions are indicated on the main line. For variable residues, the possibilities are indicated above and below the main line. The characteristic charged residue of activating KIR and the ITIM motifs of inhibitory KIR are boxed. Two models were used to perform the ancestral sequence reconstruction. The middle panel shows the first model. The tree topology corresponds to that obtained in the Bayesian analysis performed in Fig. 1; the relevant part of the tree is displayed. The bottom panel shows the second model. This topology represents a modification of the first topology in which the KIR3DL3 and Popy-KIR2DLA/B sequences are grouped with the lineage III LTK group. This modification is based on the result presented in Fig. 3 A. The trees on the left sides of the panels show the nodes corresponding to the reconstructed sequences. Empty symbols pertain to the marginal reconstruction method alone; filled symbols pertain to both the marginal reconstruction and Bayesian methods. Positions varying among the predicted sequences and corresponding to the variable positions in the upper panel are shown in the schemes on the right sides of the panels. The amino acid substitutions leading to the different groups are shown next to the arrows joining the groups. Residues that change along each branch are in boldface type. Parentheses show positions where marginal reconstruction and Bayesian methods gave different results.
Figure 3.
Figure 3.
Expansion of the STK was driven mainly by recombination. Phylogenetic trees were constructed for nucleotide sequences corresponding to each domain of the lineage III KIR defined in Fig. 1: (A) TM/CYT–signaling domain; (B) D2 domain; (C) D1 domain; (D) D0 domain. The KIR lineages are labeled on the right side of each panel. Shaded boxes denote the STK sequences. NJ, parsimony (Pars), and Bayesian (Bay) methods gave trees with statistically similar topology; the NJ trees are shown (using a midpoint rooting). The support for each node (expressed as a percentage) was given by the NJ and parsimony bootstrap proportion and by the Bayesian posterior probability. Values are shown for nodes supported by ≥ 50% for the bootstrap proportion analyses and by ≥90% for the posterior probability analysis. Asterisks indicate values below these cutoffs. For the signaling domain (A) a fourth test, a maximum-likelihood bootstrap analysis, was performed; the bootstrap proportion was estimated for each node and indicated where ≥ 50%. At nodes the support for the four methods (NJ, Bayesian, parsimony, and maximum likelihood) are organized as shown in the upper left. Species abbreviations are as in Fig. 1. All the analyses were performed with a complete deletion dataset (supplemental Material and methods). (D) A group of sequences potentially corresponding to the STK group is boxed.
Figure 4.
Figure 4.
Rhesus monkey activating 3Ig KIR use a modified KIR2DL4 signaling domain. Phylogenetic trees were constructed for nucleotide sequences corresponding to each domain of the lineage I-A and IV KIR defined in Fig. 1: (A) TM/CYT signaling domain; (B) D2 domain (the tree was rerooted because the midpoint rooting was influenced by the long branch of the group containing Mm-KIR3DL9 and Mm-KIR3DL10); (C) D1 domain; (D) D0 domain. Tree construction, evaluation, and statistical tests were as described in the legend of Fig. 3; representative NJ trees are shown. Species abbreviations are as in Fig. 1.
Figure 5.
Figure 5.
Signaling adaptor molecules DAP12 and FCER1G existed long before the emergence of activating primate KIR and rodent Ly49 receptors. Phylogenetic trees (A) of the DAP12 family and (B) of the FCER1G family. Tree construction, evaluation, and statistical tests were as in Fig. 3; representative NJ trees are shown. For simplification, some groups of sequences were collapsed; the number of the sequences in such groups is indicated.
Figure 6.
Figure 6.
Activating Ly49 evolved by functional shift of inhibitory Ly49 and subsequent expansion through recombination. Phylogenetic trees were constructed from nucleotide sequences corresponding to the different domains of Ly49 receptors: (A) the cytoplasmic domain and transmembrane region (CYT/TM)–signaling domain; the stalk (not shown); and (B) the lectinlike domain. Ly49 with activating function or potential are boxed (including pseudogenes that would encode activating receptors in the absence of frameshifts). The predicted activating horse Ly49C (67) is also boxed, although the position of its charged residue in the TM differs from that of known activating Ly49. Tree construction, evaluation, and statistical tests were as in Fig. 3; representative NJ trees are shown. Reconstruction of the ancestral sequences was performed for four nodes of the signaling domain tree (arrows in A), using marginal reconstruction and Bayesian analysis. The presence of an ITIM in the CYT and a charged residue in the TM is indicated for each of these nodes. For simplification, the mouse sequences lack species abbreviations (strains are indicated in parentheses). Ψ indicates a pseudogene or a sequence with an abnormal frame. Predicted rat sequences are indicated by a number in parenthesis. Bta, Bos Taurus; Car, Carnivora; Cet, Cetartiodactyla; Cfa, Canis familiaris; Eca, Equus caballus; Fca, Felis catus; Hsa, Homo sapiens; Per, Perissodactyla; Pha, Papio hamadryas; Popy, Pongo pygmaeus; Rno, Rattus norvegicus; Ssc, Sus scrofa.
Figure 7.
Figure 7.
Model for the emergence and loss of activating KIR and Ly49. (A) An inferred history for the origin and spread of hominoid STK, rhesus monkey KIR3DH, and activating Ly49 in rodents is shown. Boxes represent the different protein domains. For the signaling domain, charged residues and ITIMs are represented by the corresponding amino acid and by a filled square, respectively. When recombinant structures are present, the lineage of the recombinant domains is indicated by a roman letter below the domain. (B) Two-stage model for the emergence and loss of activating KIR and Ly49. The creation of an activating receptor is followed by a rapid increase in frequency caused by the beneficial effects (resistance to pathogens, increase in reproductive success). When the selective advantage of the activating receptor disappears, its negative effects (disabilities caused by autoimmunity or a detrimentally high birthrate) lead to decreasing frequency and eventual gene loss. Alternatively, or in parallel to this decrease in frequency, substitutions that decrease or eliminate the function of the activating receptor can occur and be selected.

References

    1. Biron, C.A., K.B. Nguyen, G.C. Pien, L.P. Cousens, and T.P. Salazar-Mather. 1999. Natural killer cells in antiviral defense: function and regulation by innate cytokines. Annu. Rev. Immunol. 17:189–220. - PubMed
    1. French, A.R., and W.M. Yokoyama. 2003. Natural killer cells and viral infections. Curr. Opin. Immunol. 15:45–51. - PubMed
    1. Diefenbach, A., and D.H. Raulet. 2002. The innate immune response to tumors and its role in the induction of T-cell immunity. Immunol. Rev. 188:9–21. - PubMed
    1. Dupont, B., and K.C. Hsu. 2004. Inhibitory killer Ig-like receptor genes and human leukocyte antigen class I ligands in haematopoietic stem cell transplantation. Curr. Opin. Immunol. 16:634–643. - PubMed
    1. Moffett-King, A. 2002. Natural killer cells and pregnancy. Nat. Rev. Immunol. 2:656–663. - PubMed

Publication types

MeSH terms