. 2005 May;3(5):e157.
doi: 10.1371/journal.pbio.0030157. Epub 2005 Apr 26.

Three-dimensional maps of all chromosomes in human male fibroblast nuclei and prometaphase rosettes

Affiliations

Three-dimensional maps of all chromosomes in human male fibroblast nuclei and prometaphase rosettes

Andreas Bolzer et al. PLoS Biol. 2005 May.

Abstract

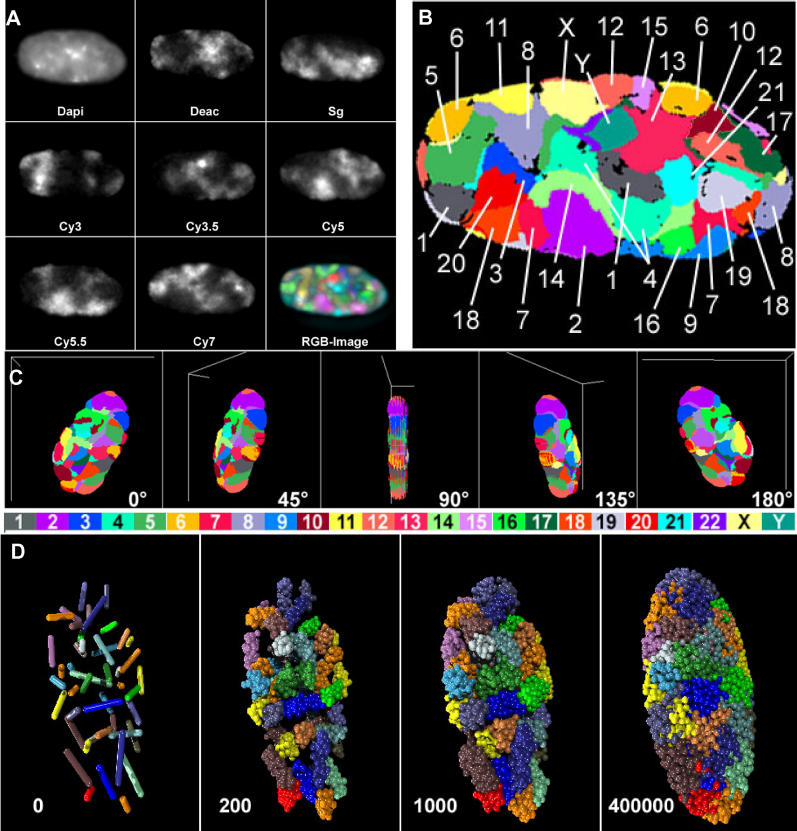
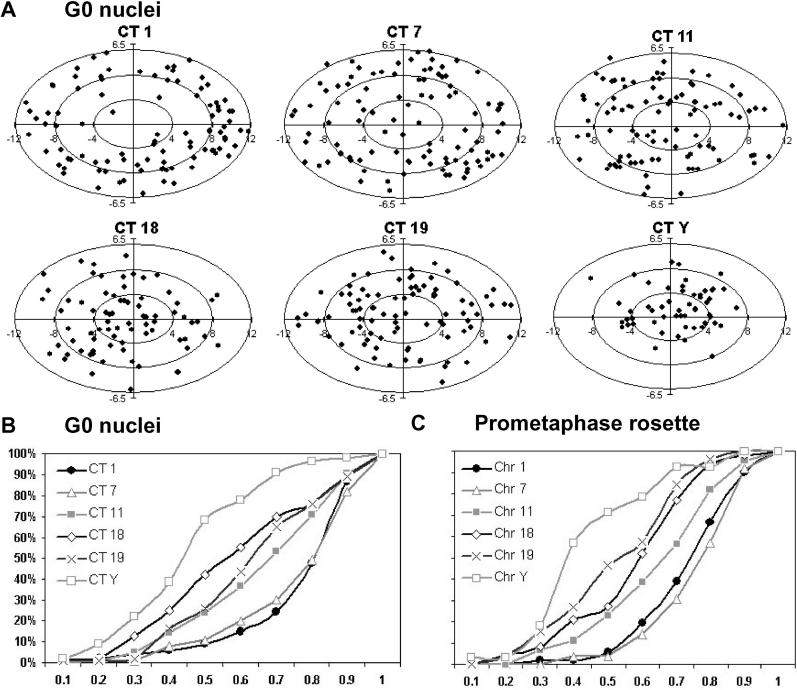
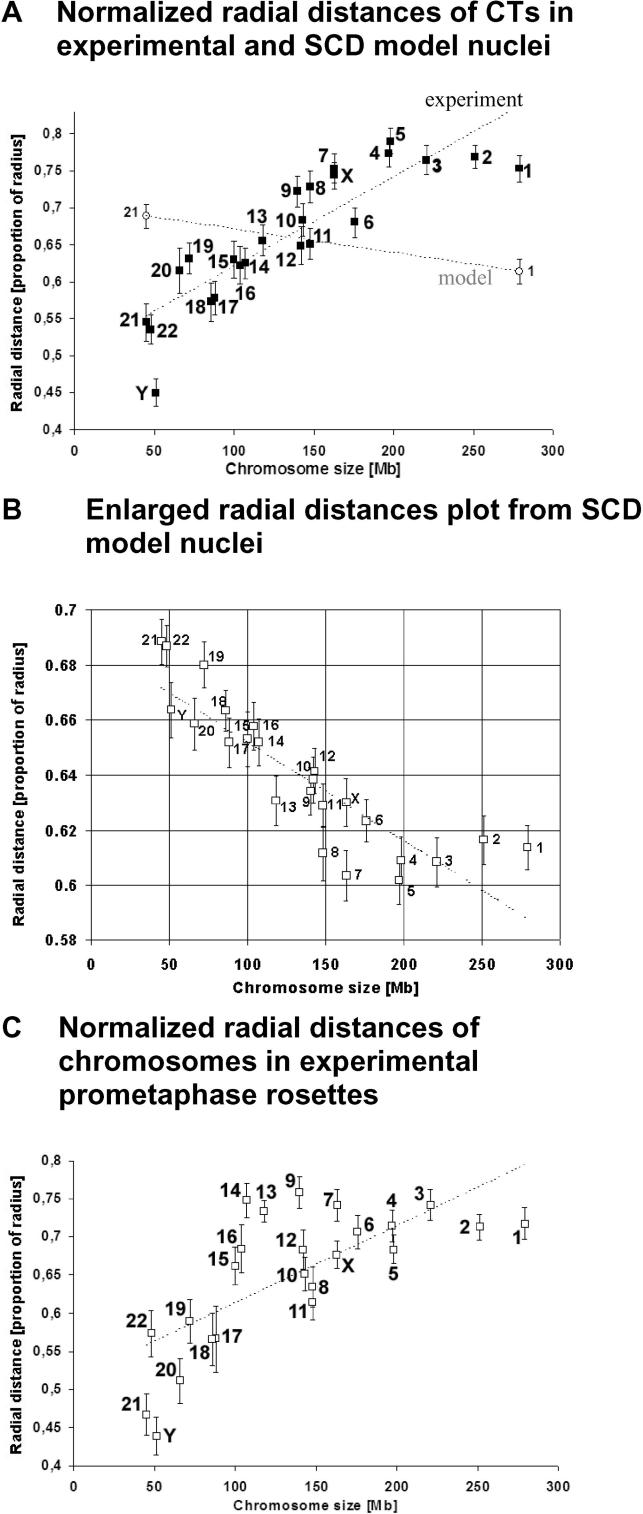
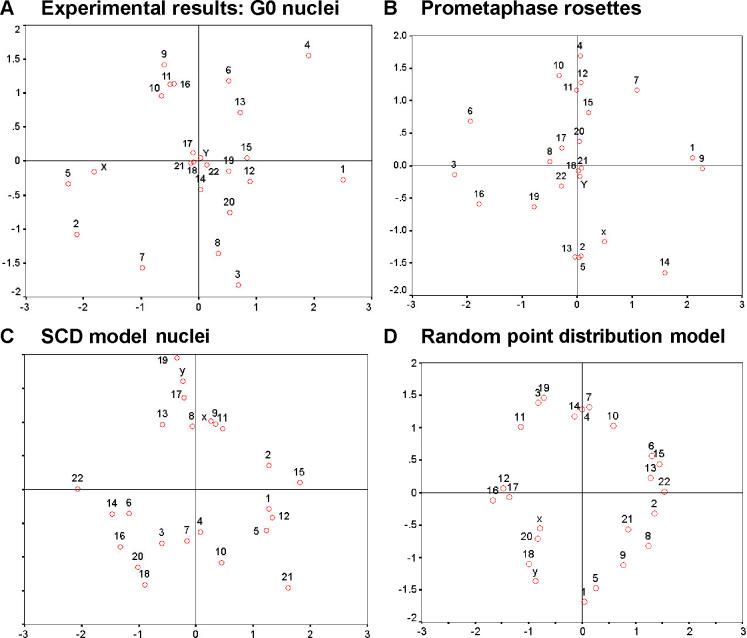
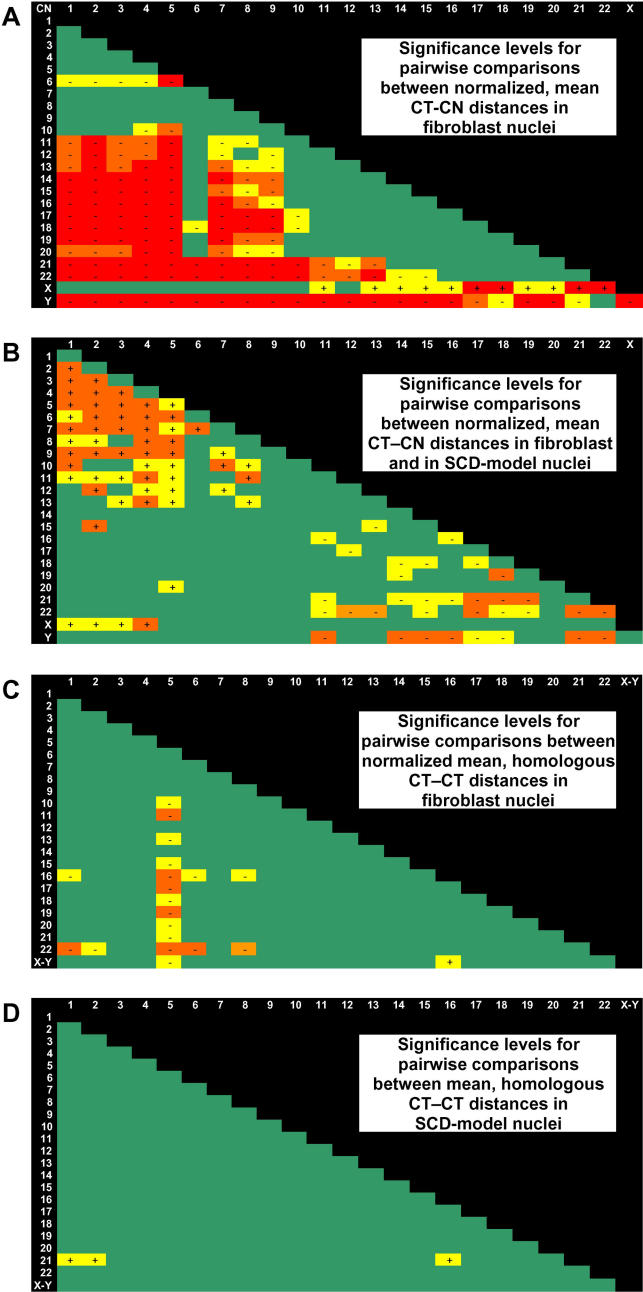
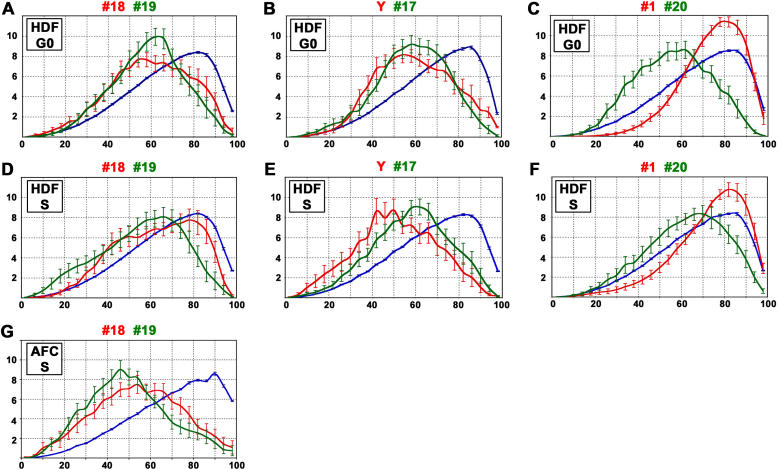
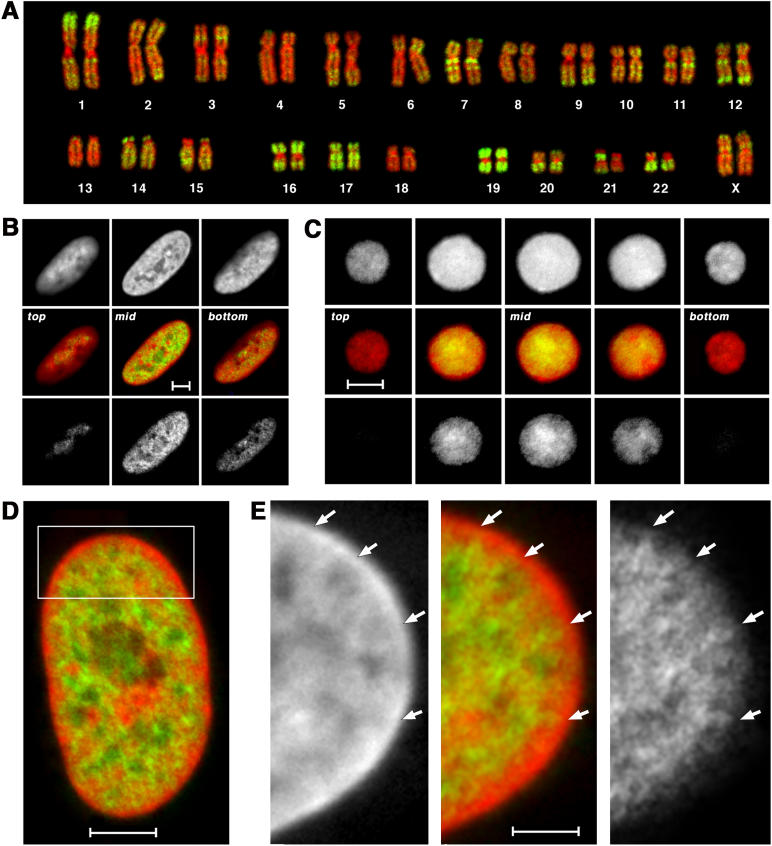
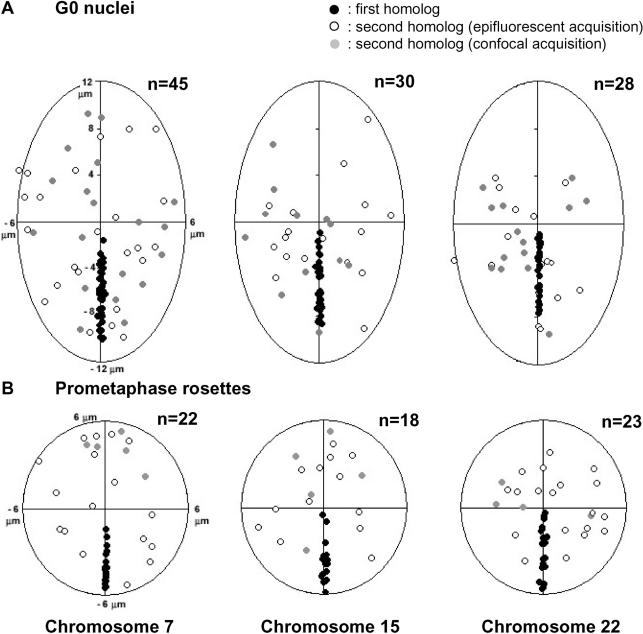
Studies of higher-order chromatin arrangements are an essential part of ongoing attempts to explore changes in epigenome structure and their functional implications during development and cell differentiation. However, the extent and cell-type-specificity of three-dimensional (3D) chromosome arrangements has remained controversial. In order to overcome technical limitations of previous studies, we have developed tools that allow the quantitative 3D positional mapping of all chromosomes simultaneously. We present unequivocal evidence for a probabilistic 3D order of prometaphase chromosomes, as well as of chromosome territories (CTs) in nuclei of quiescent (G0) and cycling (early S-phase) human diploid fibroblasts (46, XY). Radial distance measurements showed a probabilistic, highly nonrandom correlation with chromosome size: small chromosomes-independently of their gene density-were distributed significantly closer to the center of the nucleus or prometaphase rosette, while large chromosomes were located closer to the nuclear or rosette rim. This arrangement was independently confirmed in both human fibroblast and amniotic fluid cell nuclei. Notably, these cell types exhibit flat-ellipsoidal cell nuclei, in contrast to the spherical nuclei of lymphocytes and several other human cell types, for which we and others previously demonstrated gene-density-correlated radial 3D CT arrangements. Modeling of 3D CT arrangements suggests that cell-type-specific differences in radial CT arrangements are not solely due to geometrical constraints that result from nuclear shape differences. We also found gene-density-correlated arrangements of higher-order chromatin shared by all human cell types studied so far. Chromatin domains, which are gene-poor, form a layer beneath the nuclear envelope, while gene-dense chromatin is enriched in the nuclear interior. We discuss the possible functional implications of this finding.


Figures

Figure 1
Figure 1. 24-Color 3D FISH Representation and Classification of Chromosomes in a Human G0 Fibroblast Nucleus
(A) A deconvoluted mid-plane nuclear section recorded by wide-field microscopy in eight channels: one channel for DAPI (DNA counterstain) and seven channels for the following fluorochromes: diethylaminocoumarin (Deac), Spectrum Green (SG), and the cyanine dyes Cy3, Cy3.5, Cy5, Cy5.5, and Cy7. Each channel represents the painting of a CT subset with the respective fluorochrome. The combinatorial labeling scheme is described in Materials and Methods. RGB images of the 24 differently labeled chromosome types (1–22, X, and Y) were produced by superposition of the seven channels (bottom right). (B) False color representation of all CTs visible in this mid-section after classification with the program goldFISH. (C) 3D reconstruction of the complete CT arrangement in the nucleus viewed from different angles. (D) Simulation of a human fibroblast model nucleus according to the SCD model (see Materials and Methods). The first image shows 46 statistically placed rods representing the 46 human chromatids. The next three images simulate the decondensation process and show the resulting CT arrangement obtained after different numbers of Monte Carlo relaxation steps (200, 1,000, and 400,000). This set of figures is taken from Video S1.
Figure 2
Figure 2. Radial Chromosome Positions Correlate with Chromosome Size in Quiescent Human Fibroblasts (G0)
(A) Two-dimensional projections of the IGCs of CTs 1, 7, 11, 18, 19, and Y studied in 54 nuclei are represented by dots. Ellipses represent the 2D shape of a fibroblast nucleus normalized for shape and size and rotated so that the long axis of each nucleus evaluated lies on the abscissa. Projections of IGCs for all CTs are shown in Figure S2. Note that we were not able to distinguish in nuclei between a “north” and “south” pole of the short axis or a “west” and “east” pole of the long axis. Either fibroblast nuclei do not possess such compass polarizations or we lack markers to recognize them. Accordingly, distance comparisons between IGCs located in different quadrants of the ellipse are not meaningful. (B) Cumulative 3D distance graphs of the CT distribution within a normalized nucleus taken from the data (A). The abscissa represents the normalized radial 3D distances of CTs 1, 7, 11, 18, 19, and Y from the center of the nucleus (CN; IGC of the DAPI-stained nucleus) to the IGC of a specific CT. The origin represents the CN, and “1” represents the nuclear periphery. The Ordinate represents the cumulative percentage of normalized 3D CN–CT distances. Cumulative graphs for the entire set of chromosomes are shown in Figure S4. (C) Cumulative 3D distance graphs of PC distribution within a normalized prometaphase rosette. Abscissa and ordinate are as in (B), with PC being the IGC of a prometaphase chromosome and CR the center of the prometaphase rosette. IGC projections and cumulative graphs for all PCs are shown in Figures S3 and S6, respectively.
Figure 3
Figure 3. Normalized Radial Chromosome Distances in G0 Fibroblast Nuclei, SCD Model Nuclei, and Prometaphase Rosettes
(A) Normalized 3D radial CN–CT distances (filled squares) show a positive correlation with chromosome size (indicated by DNA content): CTs of small chromosomes were preferentially located in the center of the nucleus, whereas CTs of large chromosomes were found more often at the nuclear periphery. Open circles 1 and 21 indicate the endpoints of SCD model data simulating a statistical placement of CTs. (B) SCD model data indicate that geometrical constraints result in a reverse pattern of CT distributions, i.e., modeled small CTs show a significantly higher probability of being localized at the nuclear periphery, while modeled large CTs adopt a more internal localization. (C) In agreement with normalized 3D CN–CT distances, normalized 3D CR–PC distances also show a positive correlation with the DNA content or size of chromosomes: small PCs were preferentially located near the CR, large chromosomes at the rosette periphery.
Figure 4
Figure 4. MDS Plots of Experimental and Simulated Heterologous Distances
(A) The MDS plot provides a 2D distance map of the mean locations of the IGCs of all heterologous CTs established from 54 G0 nuclei (for further explanations see Materials and Methods). The units (dimension 1 and dimension 2) are arbitrary. (B) MDS plot for all heterologous PCs in 28 prometaphase rosettes. (C) MDS plot for statistically placed CTs in 50 SCD model nuclei. (D) MDS plot for 50 model nuclei with points randomly placed with a random number generator.
Figure 5
Figure 5. Significance Levels for Pairwise Comparisons of 3D Distance Measurements Performed in 54 G0 Fibroblast Nuclei and in 50 SCD Model Nuclei
Significance levels determined by the two-tailed K-S test are indicated by colors. Green, not significant, p > 0.01; yellow, p < 0.01; orange, p < 0.001; red, p < 0.0001. A minus (or plus) sign in a colored field indicates that the 3D CN–CT (A and B) or 3D CT–CT distance (C and D) indicated at the left (row) revealed a significantly shorter (or greater) mean radial distance than the CT indicated at the top (column). (A) Comparison of 3D CN–CT distances in G0 fibroblast nuclei. (B) Comparison of 3D CT–CN distances in fibroblast nuclei (vertical row) with 3D CN–CT distances in SCD model nuclei (horizontal row). (C) Comparison of 3D CT–CT distances between homologous chromosomes in G0 fibroblast nuclei. (D) Comparison of 3D CT–CT distances between homologous chromosomes in SCD model nuclei.
Figure 6
Figure 6. Comparison of Radial CT Positions in Quiescent and Proliferating Cell Nuclei
The abscissa shows the radial 3D distribution of CT-specific and whole-DNA-specific voxels in 25 concentric nuclear shells. The origin represents the center of the nucleus, and “100” represents the nuclear border. The ordinate indicates the mean frequency of the intensity-weighted voxels above threshold in each shell (in percent). Example images are shown in Figure S8. Bars correspond to standard errors of the mean. (A–F) A semi-confluent human diploid fibroblast (HDF) culture containing both quiescent cells (G0) and proliferating cells was used for two-color 3D FISH with different pairs of chromosome paint probes. In each experiment light-optical serial sections were recorded from 20 G0 nuclei (A–C) and 20 nuclei at early S-phase (D–F). All voxels attributed to a segmented CT were used to describe its radial position (red and green curves). Blue curves show the voxel-based radial distribution of whole DNA stained with TOPRO-3. Comparison of (A and D) gene-poor HSA 18 (red curve) and gene-rich HSA 19 (green curve), (B and E) gene-poor HSA Y (red curve) and gene-rich HSA 17 (green curve), and (C and F) large HSA 1 (red curve) and small HSA 20 (green curve). Irrespective of their gene content the small HSAs 17, 18, 19, 20, and Y were all located significantly closer towards the nuclear interior compared to the distribution of the whole nuclear DNA (p < 0.05, two-tailed K-S test). The difference between the radial location of pair HSA 18/19 CTs both in quiescent and cycling cell nuclei, however, was not significant. For the pair HSA 17/Y, no significant difference was obtained between G0 and S-phase nuclei (p > 0.05, Students t-test [t-test]). In contrast, HSA 1 was significantly shifted towards the nuclear border compared to HSA 20 (p < 0.001, t-test), although HSAs 1 and 20 have a similar overall gene density. (G) Comparison of HSA 18 (red curve) and HSA 19 (green curve) in nuclei of proliferating amniotic fluid cells during S-phase (n = 18). Although there is a slight excess of CT 19 voxels towards the nuclear interior compared to CT 18 voxels, the two curves are not significantly different (p > 0.05; t-test).
Figure 7
Figure 7. Localization of Alu Sequences in Nuclei of Fibroblasts and Lymphocytes
(A) Karyotype from a female human lymphocyte (46, XX). Chromosomes were hybridized with a probe for Alu sequences (green) and counterstained with TOPRO-3 (red). Alu sequences were used as a marker for chromosomes and chromosome bands rich in genes. (B and C) Confocal serial sections were obtained from a human G0 fibroblast nucleus (B) and a G0 lymphocyte nucleus from peripheral blood (C) after 3D FISH with the Alu probe (green) and TOPRO-3 counterstaining (red). As examples, sections made at the top, middle, and bottom of the nuclei (separated by about 1 μm) are shown from left to right. Scale bars, 5 μm. (D) Enlarged confocal mid-section through the human G0 fibroblast nucleus. Scale bar, 5 μm. (E) Enlargement of the boxed sector in (D). The color image in the middle reflects the merged images left (TOPRO-3 counterstaining, red) and right (Alu staining, green). Arrows indicate chromatin rich in Alu sequences expanding into the TOPRO-3-stained, Alu-poor nuclear rim. Scale bar, 2 μm.
Figure 8
Figure 8. Relative Spatial Distributions of Homologous Chromosomes of HSAs 7, 15, and 22
Schematic outlines of fibroblast nuclei (as ellipses, A) and prometaphase rosettes (as circles, B) with normalized size and shape. The IGC of one randomly selected homolog was placed along the negative long axis. The IGC of the other homolog was marked at the corresponding nuclear position. Gray dots represent data obtained by confocal microscopy, open circles by wide-field microscopy. Angle measurements for all pairs of homologous chromosomes are presented in Figure S9 for G0 nuclei and in Figure S10 for rosettes.

Similar articles

Cited by

References

    1. van Driel R, Fransz PF, Verschure PJ. The eukaryotic genome: A system regulated at different hierarchical levels. J Cell Sci. 2003;116:4067–4075. - PubMed
    1. Cremer T, Kurz A, Zirbel R, Dietzel S, Rinke B, et al. Role of chromosome territories in the functional compartmentalization of the cell nucleus. Cold Spring Harb Symp Quant Biol. 1993;58:777–792. - PubMed
    1. Cremer T, Kreth G, Koester H, Fink RH, Heintzmann R, et al. Chromosome territories, interchromatin domain compartment, and nuclear matrix: An integrated view of the functional nuclear architecture. Crit Rev Eukaryot Gene Expr. 2000;10:179–212. - PubMed
    1. Cremer T, Cremer C. Chromosome territories, nuclear architecture and gene regulation in mammalian cells. Nat Rev Genet. 2001;2:292–301. - PubMed
    1. Parada LA, Misteli T. Chromosome positioning in the interphase nucleus. Trends Cell Biol. 2002;12:425. - PubMed

Publication types