. 2005 Apr;2(4):e106.
doi: 10.1371/journal.pmed.0020106. Epub 2005 Apr 26.

Nonstationary influence of El Niño on the synchronous dengue epidemics in Thailand

Affiliations

Nonstationary influence of El Niño on the synchronous dengue epidemics in Thailand

Bernard Cazelles et al. PLoS Med. 2005 Apr.

Abstract

Background: Several factors, including environmental and climatic factors, influence the transmission of vector-borne diseases. Nevertheless, the identification and relative importance of climatic factors for vector-borne diseases remain controversial. Dengue is the world's most important viral vector-borne disease, and the controversy about climatic effects also applies in this case. Here we address the role of climate variability in shaping the interannual pattern of dengue epidemics.

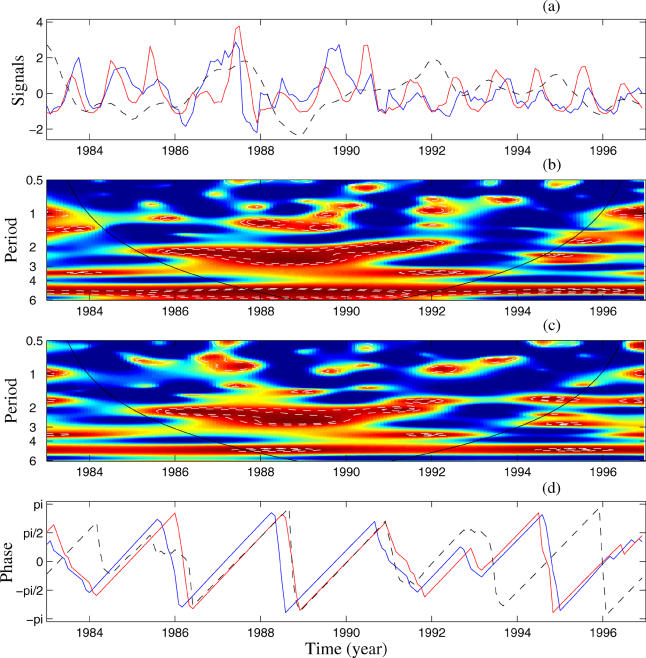
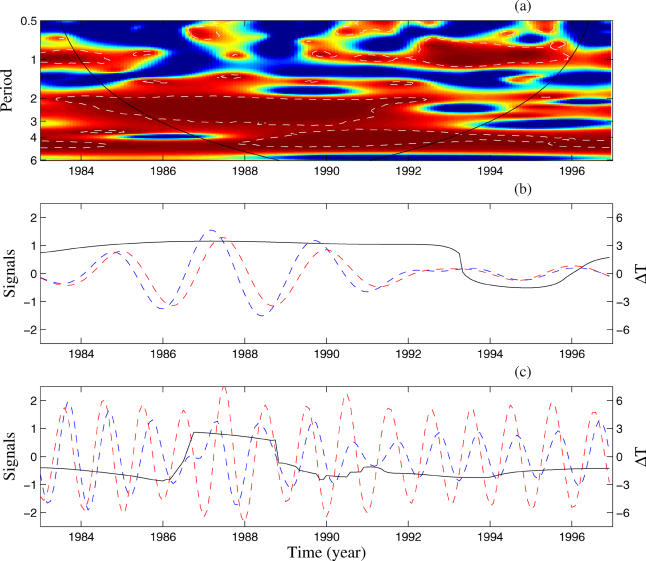
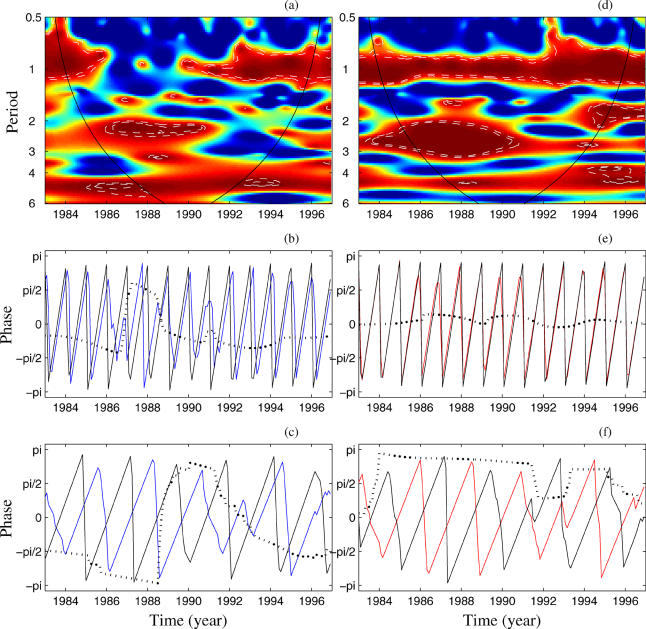
Methods and findings: We have analysed monthly data for Thailand from 1983 to 1997 using wavelet approaches that can describe nonstationary phenomena and that also allow the quantification of nonstationary associations between time series. We report a strong association between monthly dengue incidence in Thailand and the dynamics of El Niño for the 2-3-y periodic mode. This association is nonstationary, seen only from 1986 to 1992, and appears to have a major influence on the synchrony of dengue epidemics in Thailand.

Conclusion: The underlying mechanism for the synchronisation of dengue epidemics may resemble that of a pacemaker, in which intrinsic disease dynamics interact with climate variations driven by El Niño to propagate travelling waves of infection. When association with El Niño is strong in the 2-3-y periodic mode, one observes high synchrony of dengue epidemics over Thailand. When this association is absent, the seasonal dynamics become dominant and the synchrony initiated in Bangkok collapses.


Conflict of interest statement

Competing Interests: The authors have declared that no competing interests exist.

Figures

Figure 1
Figure 1. Association between Dengue in Bangkok and in the Rest of Thailand with El Niño Based on Wavelet Analysis
(A) Bangkok dengue incidence (blue line), Thailand dengue incidence (red line), and Nino 3 index (black dashed line). The incidence series are square root transformed, and all series are normalised. (B) Wavelet coherence between dengue in Bangkok and Nino 3, computed using the Morlet wavelet function. The colours code for power values from dark blue for low coherence to dark red for high coherence. The nested white dashed lines show the α = 5% and α = 10% significance levels computed based on 1,000 bootstrapped series. The cone of influence indicates the region not influenced by edge effects. (C) Wavelet coherence between dengue incidence in the rest of Thailand and Nino 3. Colours as in (B). (D) Phases of time series (colours as in [A]) computed in the 2–3-y periodic band.
Figure 2
Figure 2. Synchronisation between Dengue Incidence in Bangkok and in the Rest of Thailand
The incidence series are square root transformed, and all series are normalised. (A) Wavelet coherence computed based on the Morlet wavelet function between dengue incidence in Bangkok and in the rest of Thailand; colours as in Figure 1B. The white dashed lines show the α = 5% significance level computed based on 1,000 bootstrapped series. (B) Oscillating components computed with the wavelet transform in the 2–3-y period band (colours as in Figure 1A). (C) Oscillating components computed with the wavelet transform in the 0.8–1.2-y period band (colours as in Figure 1A). In (B) and (C) the black line shows the time evolution of the instantaneous time delay in months (ΔT) between the oscillating components of the two incidence time series.
Figure 3
Figure 3. Association between Precipitation and Dengue Incidence
For precipitation, gridded data [22] spatially averaged over rectangular areas representing Bangkok and the rest of Thailand using the IRI climate data library (http://ingrid.ldgo.columbia.edu/SOURCES/UEA/CRU/New/CRU05/monthly/) are used. The incidence series are square root transformed, and all series are normalised. The left part of the figure concerns Bangkok and the right part the rest of Thailand. On phase graphs, colours are as in Figure 1, and the dotted lines are for the phase difference between the considered series. (A) and (D) Wavelet coherence (see Figure 1B). (B) and (E) Phase evolutions of the considered series computed with the wavelet transform in the 0.8–1.2-y period band. (C) and (F) Phase evolutions computed in the 2–3-y period band.

References

    1. World Health Ov. WHO report on global surveillance of epidemic-prone infectious diseases. WHO/CDS/CSR/ISR/2000.1. Geneva: World Health Organization. Available: http://www.who.int/csr/resources/publications/surveillance/en/WHO_Report... . 2000 Accessed 8 March 2005.
    1. Guzmàn MG, Kouri G. Dengue: An update. Lancet Infect Dis. 2002;2:33–42. - PubMed
    1. Epstein PR, Diaz HF, Elias S, Grabherr G, Graham NE, et al. Biological and physical signs of climate change: Focus on mosquito-borne diseases. Bull Am Meteorol Soc. 1998;79:409–417.
    1. Patz JA. Public health risk assessment linked to climatic and ecological change. Hum Ecol Risk Assess. 2001;7:1317–1327.
    1. Patz JA, Reisen WK. Climate-change and vector-borne diseases. Trends Immunol. 2001;22:171–172. - PubMed

Publication types