. 2005 Apr 26;102(17):5992-7.
doi: 10.1073/pnas.0502267102. Epub 2005 Apr 19.

Perturbational profiling of a cell-line model of tumorigenesis by using metabolic measurements

Affiliations

Perturbational profiling of a cell-line model of tumorigenesis by using metabolic measurements

Arvind Ramanathan et al. Proc Natl Acad Sci U S A. .

Abstract

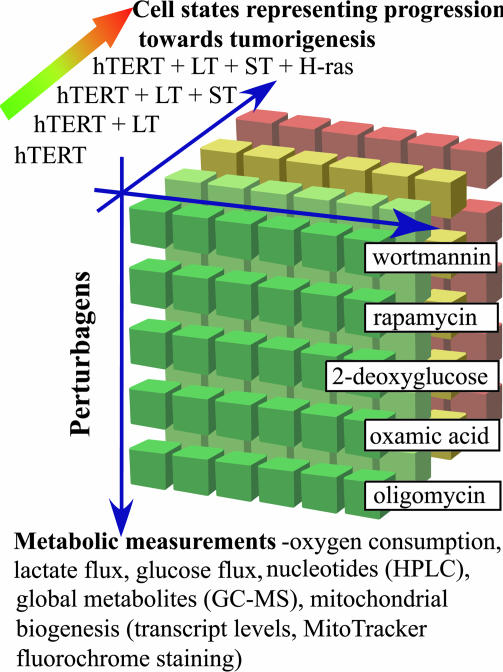
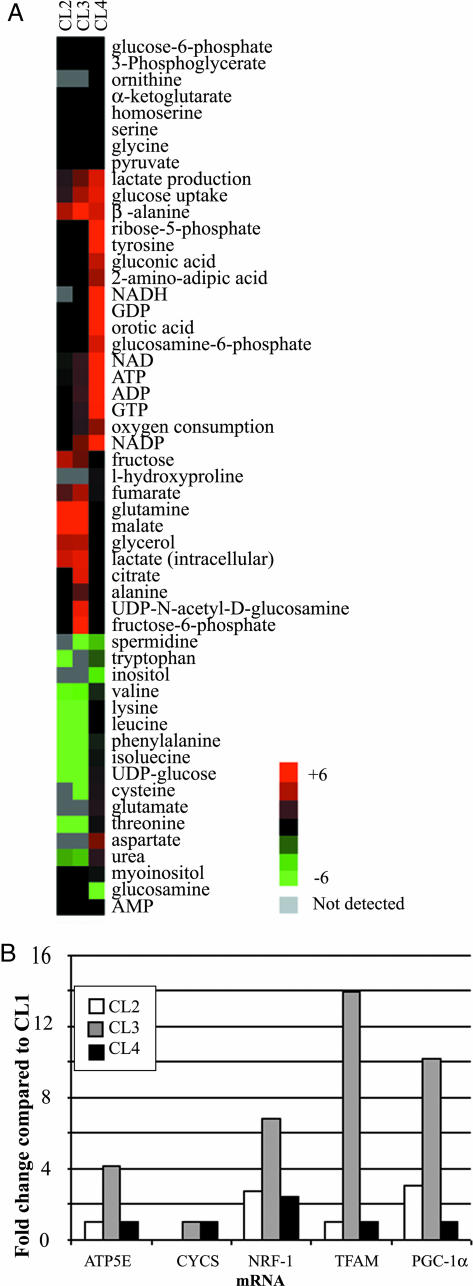
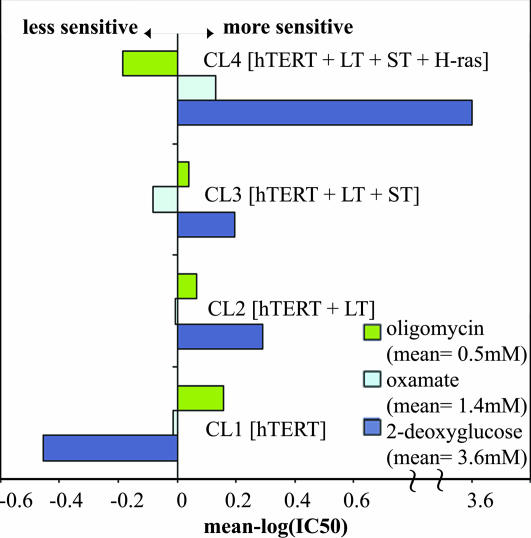
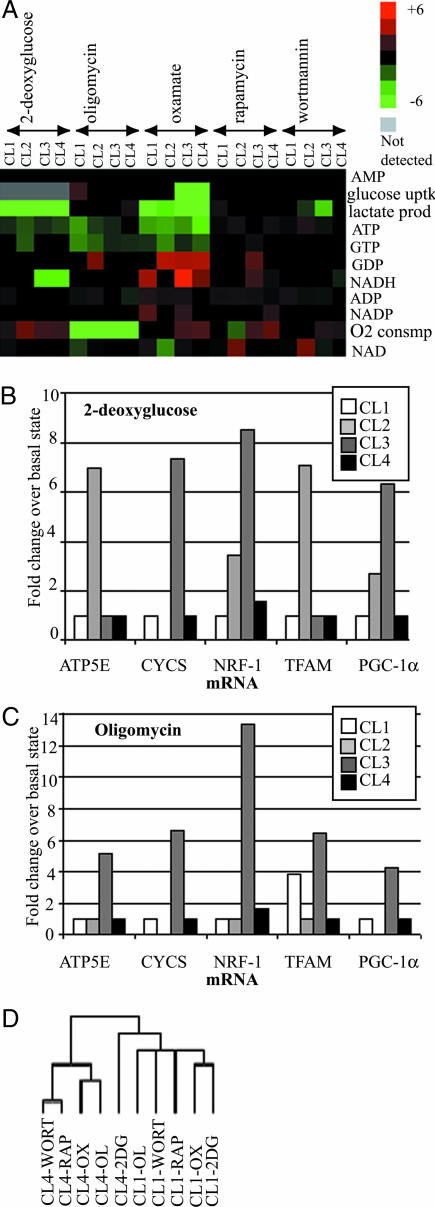
Weinberg and coworkers have used serial transduction of a human, primary fibroblast cell line with the catalytic domain of human telomerase, large T antigen, small T antigen, and an oncogenic allele of H-ras to study stages leading toward a fully transformed cancerous state. We performed a three-dimensional screening experiment using 4 cell lines, 5 small-molecule perturbagens (2-deoxyglucose, oxamate, oligomycin, rapamycin, and wortmannin), and a large number of metabolic measurements. Hierarchical clustering was performed to obtain signatures of the 4 cell lines, 24 cell states, 5 perturbagens, and a number of metabolic parameters. Analysis of these signatures and sensitivities of the cell lines to the perturbagens provided insights into the bioenergetic states of progressively transformed cell lines, the effect of oncogenes on small-molecule sensitivity, and global physiological responses to modulators of aerobic and anaerobic metabolism. We have gained insight into the relationship between two models of carcinogenesis, one (the Warburg hypothesis) based on increased energy production by glycolysis in cancer cells in response to aberrant respiration, and one based on cancer-causing genes. Rather than being opposing models, the approach described here suggests that these two models are interlinked. The cancer-causing genes used in this study appear to increase progressively the cell's dependence on glycolytic energy production and to decrease its dependence on mitochondrial energy production. However, mitochondrial biogenesis appears to have a more complex dependence, increasing to its greatest extent at an intermediate degree of transduction rather than at the fully transformed state.


Figures

Fig. 1.
Fig. 1.
Three-dimensional screening. A matrix of data was obtained by altering cell states, small-molecule perturbagens, and cell measurements. Four cell lines, which model tumorigenic conversion and were generated by Weinberg and coworkers (BJ fibroblast cells serially transduced with the four indicated oncogenes), were treated with five small-molecule perturbagens (wortmannin, rapamycin, 2-deoxyglucose, oxamic acid, and oligomycin). Biochemical signatures of the members of this matrix were calculated by using metabolic measurements such as oxygen consumption, glucose consumption, lactate production, and metabolite measurements, using GC-MS or HPLC.
Fig. 2.
Fig. 2.
Biochemical signatures of a cell-line model of tumorigenesis. (A) Heat map showing the relative levels of the metabolites in the four cell lines. The metabolic measurements were expressed as the fold change relative to the same measurement in the CL1 cell line. (B) The relative levels of the TFAM, CYCS, ATP5E, PGC-1α, and NRF-1 transcripts, expressed as the fold change over that in the CL1 cell line, are plotted in the bar graph.
Fig. 3.
Fig. 3.
Mean graph of the small-molecule sensitivities of the four cell lines to oligomycin, oxamate, and 2-deoxyglucose. The mean graph was constructed as defined by the Developmental Therapeutics Program of the National Cancer Institute (http://dtp.nci.nih.gov). The mean graph consists of positive (more sensitive) and negative (less sensitive) “delta” values, generated from a set of IC50 values by using a three-step calculation. The IC50 values for each of the cell lines against the small molecules were converted to log(IC50) values. For each small molecule, the log(IC50) values of the cell lines are averaged. Finally, the individual IC50 values are subtracted from this average to create a delta. The mean small-molecule sensitivities of oligomycin, oxamate, and 2-deoxyglucose are 0.5, 1.4, and 3.6 mM, respectively. Therefore, for cell line CL4, a delta value of 3.6 for 2-deoxyglucose indicates that it is ≈1,000-fold more sensitive than the average sensitivities of the four cell lines.
Fig. 4.
Fig. 4.
Perturbational profiling of cell-line models of tumorigenesis. The four cell lines were perturbed by using 2-deoxyglucose, oligomycin, oxamate, rapamycin, and wortmannin as described in Materials and Methods. (A) The fold change of the normalized levels of metabolic measurement (with respect to that of the unperturbed basal states of the respective cell lines) was used to construct heat maps. The columns in the heat map are grouped by the small-molecule perturbagen. (B) The relative levels of TFAM, CYCS, ATP5E, PGC-1α, and NRF-1 transcripts, prepared from the four cell lines after treatment with 2-deoxyglucose, were expressed as fold change over their respective levels in the unperturbed basal state and plotted on the bar graph. (C) Same analysis as in B, after the four cell lines were treated with oligomycin. (D) Hierarchical clustering of cell states and metabolites, with additional metabolite measurements from GC-MS. The columns representing the cell states are labeled by the name of the cell line followed by the perturbation. 2DG, 2-deoxyglucose; OL, oligomycin; OX, oxamate; RAP, rapamycin; WORT, wortmannin.

Similar articles

Cited by

References

    1. Hahn, W. C., Counter, C. M., Lundberg, A. S., Beijersbergen, R. L., Brooks, M. W. & Weinberg, R. A. (1999) Nature 400, 464-468. - PubMed
    1. Dolma, S., Lessnick, S. L., Hahn, W. C. & Stockwell, B. R. (2003) Cancer Cell 3, 285-296. - PubMed
    1. Norrbom, J., Sundberg, C. J., Ameln, H., Kraus, W. E., Jansson, E. & Gustafsson, T. (2004) J. Appl. Physiol. 96, 189-194. - PubMed
    1. Leung, L., Kwong, M., Hou, S., Lee, C. & Chan, J. Y. (2003) J. Biol. Chem. 278, 48021-48029. - PubMed
    1. Mootha, V. K., Lindgren, C. M., Eriksson, K. F., Subramanian, A., Sihag, S., Lehar, J., Puigserver, P., Carlsson, E., Ridderstrale, M., Laurila, E., et al. (2003) Nat. Genet. 34, 267-273. - PubMed

Publication types