

Molecular evidence of placental hypoxia in preeclampsia
- PMID: 15840747
- PMCID: PMC6428057
- DOI: 10.1210/jc.2005-0078
Molecular evidence of placental hypoxia in preeclampsia
Abstract
Background: Oxygen plays a central role in human placental pathologies including preeclampsia, a leading cause of fetal and maternal death and morbidity. Insufficient uteroplacental oxygenation in preeclampsia is believed to be responsible for the molecular events leading to the clinical manifestations of this disease.
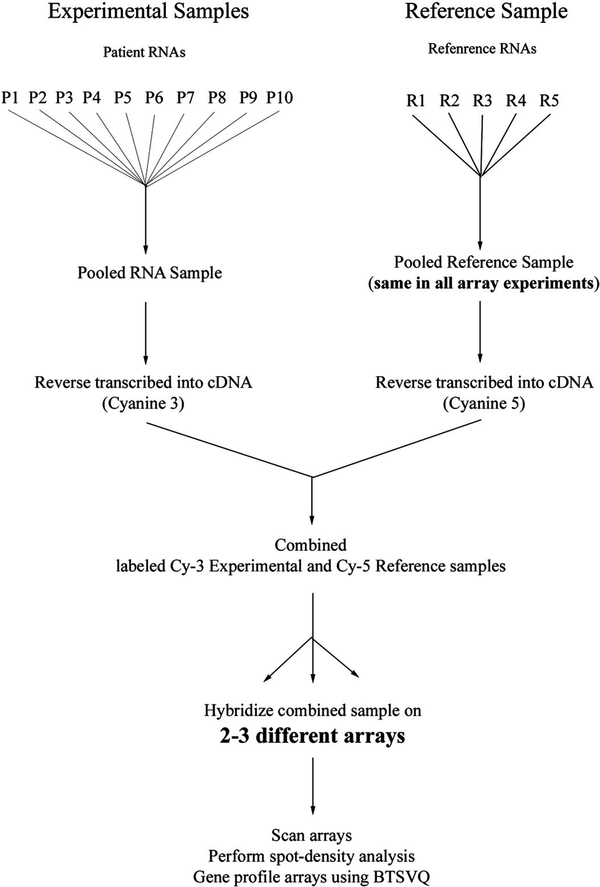
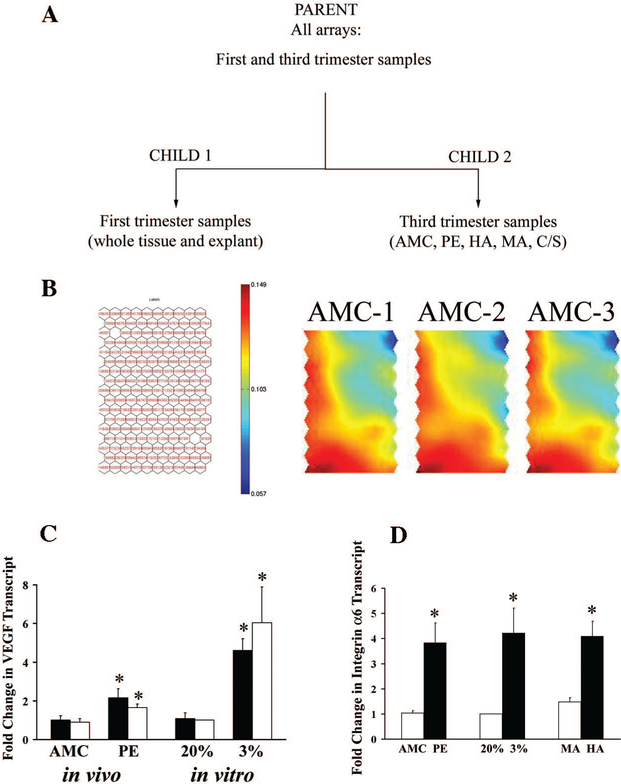
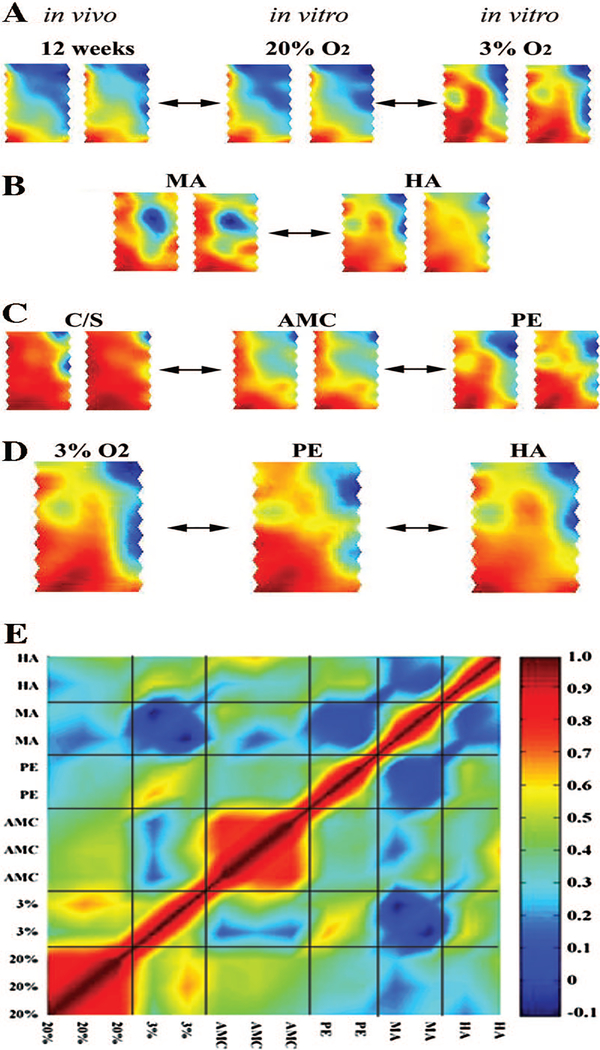
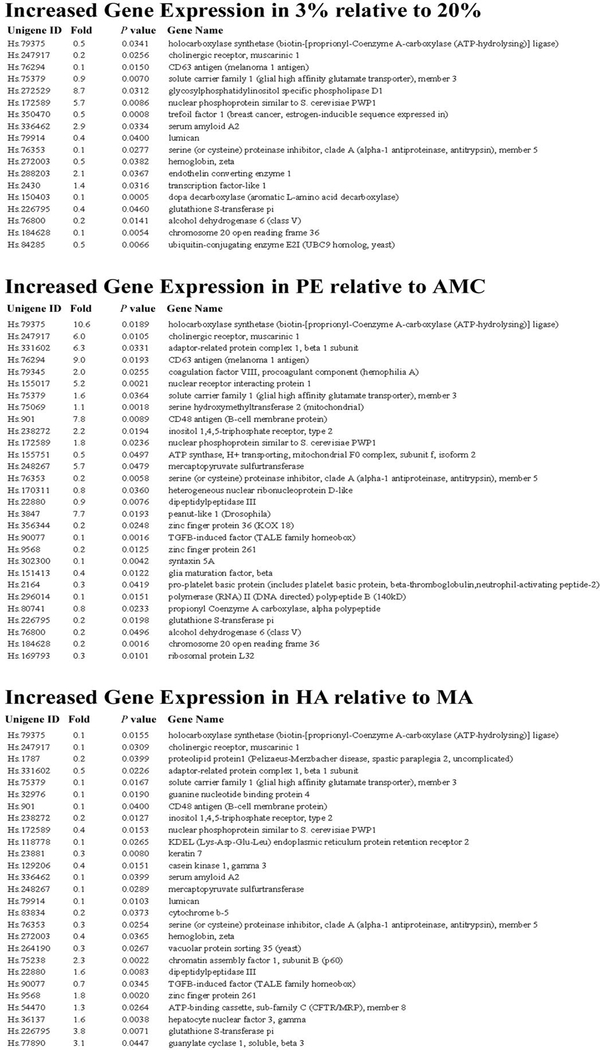
Design: Using high-throughput functional genomics, we determined the global gene expression profiles of placentae from high altitude pregnancies, a natural in vivo model of chronic hypoxia, as well as that of first-trimester explants under 3 and 20% oxygen, an in vitro organ culture model. We next compared the genomic profile from these two models with that obtained from pregnancies complicated by preeclampsia. Microarray data were analyzed using the binary tree-structured vector quantization algorithm, which generates global gene expression maps.
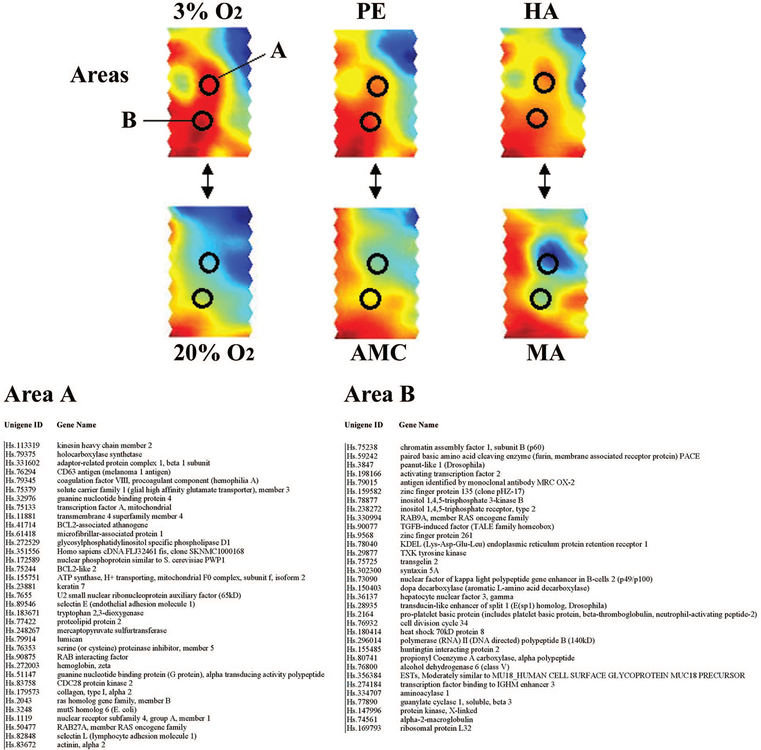
Results: Our results highlight a striking global gene expression similarity between 3% O(2)-treated explants, high-altitude placentae, and importantly placentae from preeclamptic pregnancies. We demonstrate herein the utility of explant culture and high-altitude placenta as biologically relevant and powerful models for studying the oxygen-mediated events in preeclampsia.
Conclusion: Our results provide molecular evidence that aberrant global placental gene expression changes in preeclampsia may be due to reduced oxygenation and that these events can successfully be mimicked by in vivo and in vitro models of placental hypoxia.
Figures
Similar articles
-
Increased expression of sFlt-1 in in vivo and in vitro models of human placental hypoxia is mediated by HIF-1.Am J Physiol Regul Integr Comp Physiol. 2006 Oct;291(4):R1085-93. doi: 10.1152/ajpregu.00794.2005. Epub 2006 Apr 20. Am J Physiol Regul Integr Comp Physiol. 2006. PMID: 16627691 Free PMC article.
-
In vivo uteroplacental release of placental growth factor and soluble Fms-like tyrosine kinase-1 in normal and preeclamptic pregnancies.Am J Obstet Gynecol. 2016 Dec;215(6):782.e1-782.e9. doi: 10.1016/j.ajog.2016.07.056. Epub 2016 Aug 5. Am J Obstet Gynecol. 2016. PMID: 27503620
-
Expression of von Hippel Lindau (pVHL) protein in placentae from normal pregnant women and women with preeclampsia.Placenta. 2006 Apr-May;27(4-5):411-21. doi: 10.1016/j.placenta.2005.04.002. Epub 2005 Jun 13. Placenta. 2006. PMID: 15955559
-
High-altitude hypoxia and preeclampsia.Front Biosci. 2007 May 1;12:2967-77. doi: 10.2741/2286. Front Biosci. 2007. PMID: 17485273 Free PMC article. Review.
-
Placental physioxia is based on spatial and temporal variations of placental oxygenation throughout pregnancy.J Reprod Immunol. 2023 Aug;158:103985. doi: 10.1016/j.jri.2023.103985. Epub 2023 Jun 28. J Reprod Immunol. 2023. PMID: 37406413 Review.
Cited by
-
Ferroptosis, trophoblast lipotoxic damage, and adverse pregnancy outcome.Placenta. 2021 May;108:32-38. doi: 10.1016/j.placenta.2021.03.007. Epub 2021 Mar 16. Placenta. 2021. PMID: 33812183 Free PMC article. Review.
-
Human placental hypoxia-inducible factor-1alpha expression correlates with clinical outcomes in chronic hypoxia in vivo.Am J Pathol. 2007 Jun;170(6):2171-9. doi: 10.2353/ajpath.2007.061185. Am J Pathol. 2007. PMID: 17525282 Free PMC article.
-
Gene expression patterns in human placenta.Proc Natl Acad Sci U S A. 2006 Apr 4;103(14):5478-83. doi: 10.1073/pnas.0508035103. Epub 2006 Mar 27. Proc Natl Acad Sci U S A. 2006. PMID: 16567644 Free PMC article.
-
MicroRNA-210-mediated mtROS confer hypoxia-induced suppression of STOCs in ovine uterine arteries.Br J Pharmacol. 2022 Oct;179(19):4640-4654. doi: 10.1111/bph.15914. Epub 2022 Jul 17. Br J Pharmacol. 2022. PMID: 35776536 Free PMC article.
-
Role of oxygen in fetoplacental endothelial responses: hypoxia, physiological normoxia, or hyperoxia?Am J Physiol Cell Physiol. 2020 May 1;318(5):C943-C953. doi: 10.1152/ajpcell.00528.2019. Epub 2020 Apr 8. Am J Physiol Cell Physiol. 2020. PMID: 32267717 Free PMC article. Review.
References
-
- Hustin J, Schaaps JP 1987. Echographic [corrected] and anatomic studies of the maternotrophoblastic border during the first trimester of pregnancy. Am J Obstet Gynecol 157:162–168 - PubMed
-
- Genbacev O, Zhou Y, Ludlow JW, Fisher SJ 1997. Regulation of human placental development by oxygen tension. Science 277:1669–1672 - PubMed
-
- Caniggia I, Winter JL 2002. Adriana and Luisa Castellucci Award Lecture 2001. Hypoxia inducible factor-1: oxygen regulation of trophoblast differentiation in normal and pre-eclamptic pregnancies—a review. Placenta 23(Suppl A):S47– S57 - PubMed
Publication types
MeSH terms
Substances
Grants and funding
LinkOut - more resources
Full Text Sources
Other Literature Sources
