. 2005 May;14(5):1190-200.
doi: 10.1110/ps.041258305.

Conversion of 5-aminolevulinate synthase into a more active enzyme by linking the two subunits: spectroscopic and kinetic properties

Affiliations

Conversion of 5-aminolevulinate synthase into a more active enzyme by linking the two subunits: spectroscopic and kinetic properties

Junshun Zhang et al. Protein Sci. 2005 May.

Abstract

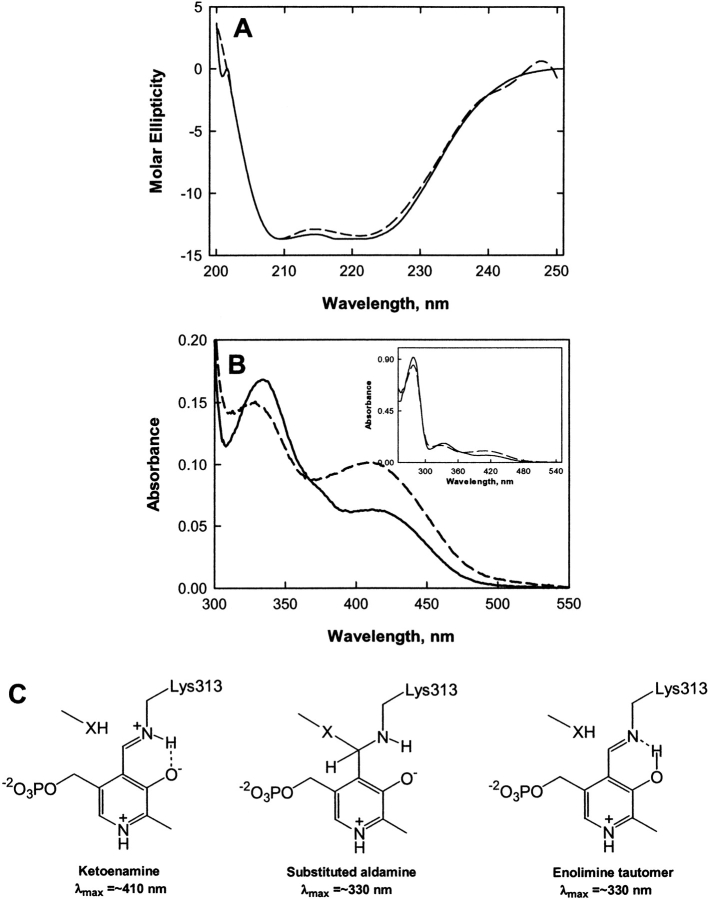
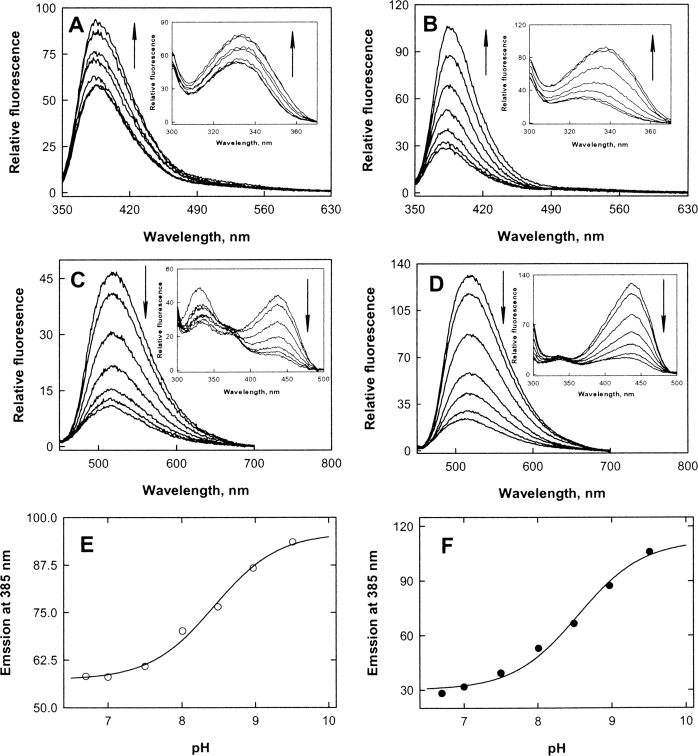
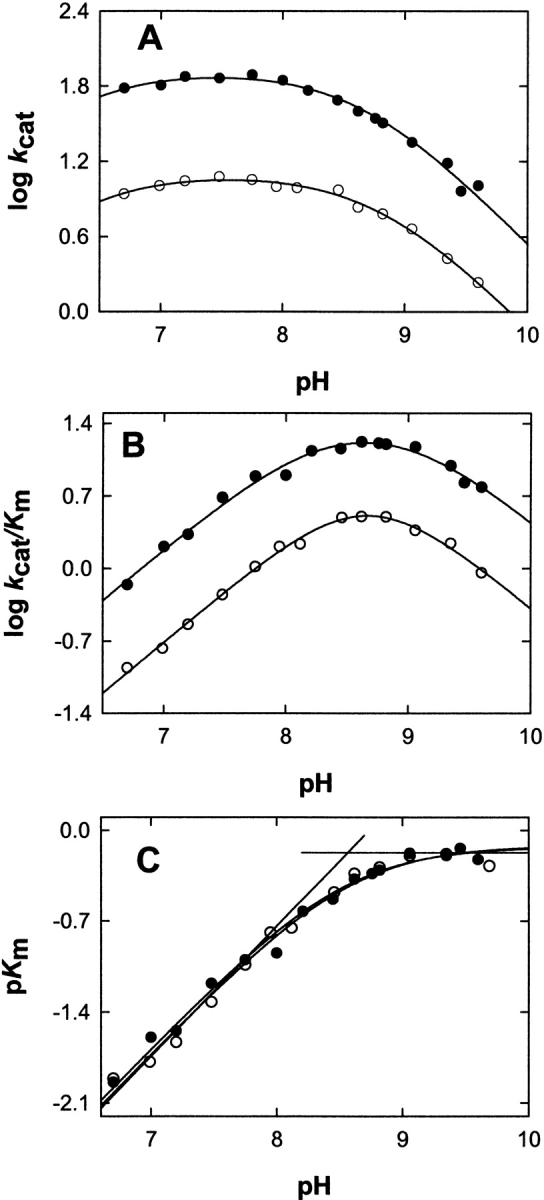
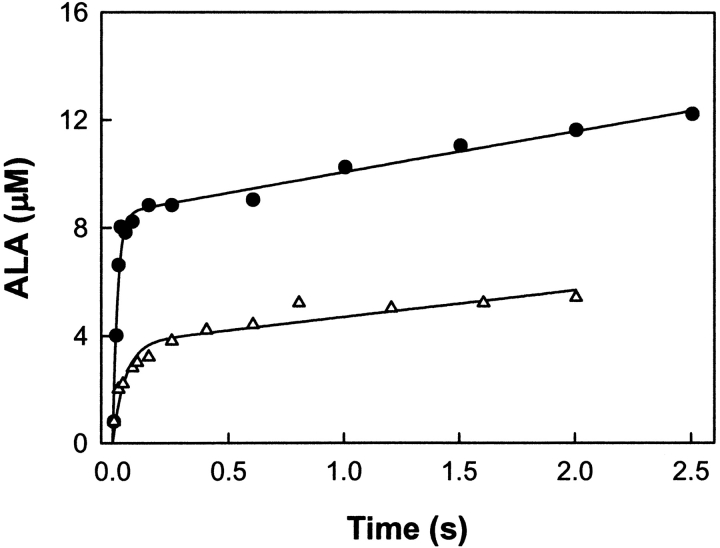
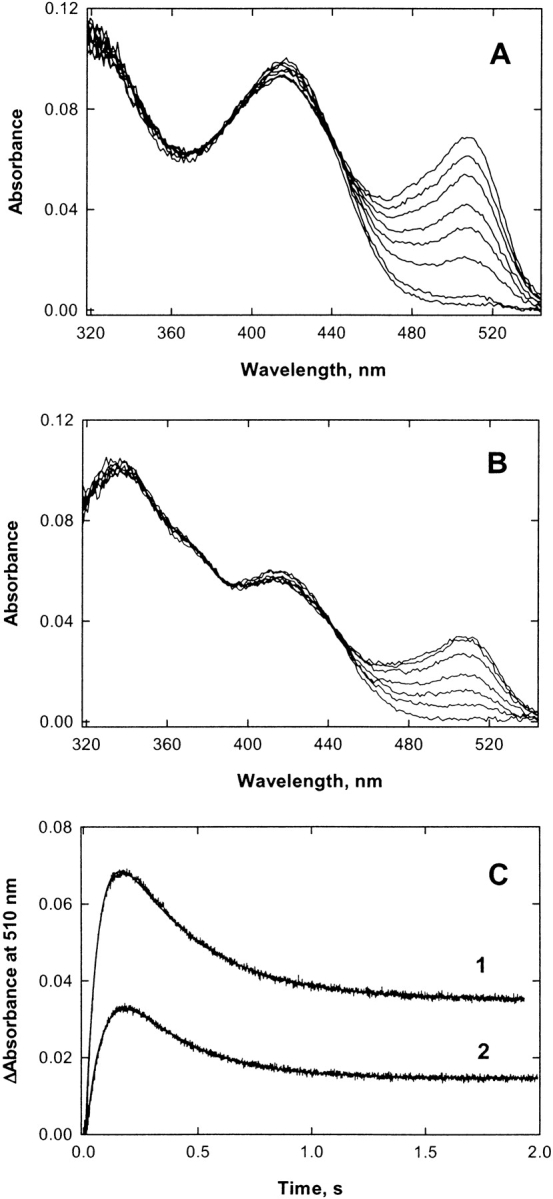
The two active sites of dimeric 5-aminolevulinate synthase (ALAS), a pyridoxal 5'-phosphate (PLP)-dependent enzyme, are located on the subunit interface with contribution of essential amino acids from each subunit. Linking the two subunits into a single polypeptide chain dimer (2XALAS) yielded an enzyme with an approximate sevenfold greater turnover number than that of wild-type ALAS. Spectroscopic and kinetic properties of 2XALAS were investigated to explore the differences in the coenzyme structure and kinetic mechanism relative to those of wild-type ALAS that confer a more active enzyme. The absorption spectra of both ALAS and 2XALAS had maxima at 410 and 330 nm, with a greater A(410)/A(330) ratio at pH approximately 7.5 for 2XALAS. The 330 nm absorption band showed an intense fluorescence at 385 nm but not at 510 nm, indicating that the 330 nm absorption species is the substituted aldamine rather than the enolimine form of the Schiff base. The 385 nm emission intensity increased with increasing pH with a single pK of approximately 8.5 for both enzymes, and thus the 410 and 330 nm absorption species were attributed to the ketoenamine and substituted aldamine, respectively. Transient kinetic analysis of the formation and decay of the quinonoid intermediate EQ(2) indicated that, although their rates were similar in ALAS and 2XALAS, accumulation of this intermediate was greater in the 2XALAS-catalyzed reaction. Collectively, these results suggest that ketoenamine is the active form of the coenzyme and forms a more prominent coenzyme structure in 2XALAS than in ALAS at pH approximately 7.5.


Figures

Figure 1.
Figure 1.
Spectroscopic (CD and absorption) properties of ALAS and 2XALAS and possible structures of internal aldimine formed between PLP and the ɛ-amino group of ALAS K313. (A) CD spectra of ALAS (——) and 2XALAS (— —). Both proteins were at 2.0 μM in 20 mM potassium phosphate, pH 7.5, and the spectra were recorded at 25°C. (B) UV-visible absorption spectra (300–550 nm) of ALAS at 15.0 μM (——) and 2XALAS at 7.75 μM (— —). (Inset) UV-visible absorption spectra (250–550 nm) of ALAS at 15.0 μM (——) and 2XALAS at 7.75 μM (— —). Both proteins were in 20 mM HEPES (pH 7.5) containing 10% glycerol. (C) Structures of the ketoenamine, enolimine, and substituted aldamine forms of the internal aldimine.
Figure 2.
Figure 2.
Fluorescence spectra of ALAS (A,C) and 2XALAS (B,D) and pH profiles for the 385 nm emission fluorescence of ALAS (E) and 2XALAS (F). (A) Fluorescence emission spectra of ALAS at pH 6.7, 7.0, 7.5, 8.0, 8.5, 9.0, and 9.5 upon excitation at 331 nm. (Inset) Fluorescence excitation spectra of ALAS at the same pH values with emission wavelength of 385 nm. (B) Fluorescence emission spectra of 2XALAS at pH 6.7, 7.0, 7.5, 8.0, 8.5, 9.0, and 9.5 upon excitation at 331 nm. (Inset) Fluorescence excitation spectra of 2XALAS at the same pH values with emission wavelength of 385 nm. (C) Fluorescence emission spectra of ALAS at pH 6.7, 7.0, 7.5, 8.0, 8.5, 9.0, and 9.5 upon excitation at 436 nm. (Inset) Fluorescence excitation spectra of ALAS at the same pH values with emission wavelength of 518 nm. (D) Fluorescence emission spectra of 2XALAS at pH 6.7, 7.0, 7.5, 8.0, 8.5, 9.0, and 9.5 upon excitation at 436 nm. (Inset) Fluorescence excitation spectra of 2XALAS at the same pH values with emission wavelength of 518 nm. (E) pH dependence of the 385 nm emission intensity of ALAS (excitation at 331 nm). (F) pH dependence of the 385 nm emission intensity of 2XALAS (excitation at 331 nm). The solid lines in E and F represent the theoretical curves from fits of the data to formula image Arrows indicate pH increase.
Figure 3.
Figure 3.
pH dependence of logkcat, log kcat/Km Gly and pKm Gly for ALAS (A) 2XALAS (B). The lines represent the nonlinear regression to Equation 2 for logkcat and logkcat/Km Gly vs. pH and Equation 3 for pKm Gly vs. pH. The filled and open symbols are for 2XALAS and ALAS, respectively. The concentrations 2XALAS (or ALAS) and succinyl-CoA were maintained at 1.0 μM (or 4.0 μM) and 20 μM, respectively, while the concentration of glycine covered a range from 0.625 to 200 mM. The buffers for different pH values are described under Materials and Methods.
Figure 4.
Figure 4.
Kinetics of a pre-steady-state burst of ALA product in the 2XALAS reaction. 2XALAS (8.6 μM) (filled circles) preincubated with glycine (200 mM) was quickly reacted with succinyl-CoA (150 μM) at 20°C. The concentrations shown in parentheses are final concentrations after mixing. The reactions were quenched with perchloric acid (0.14 M) at various aging times, and the ALA concentration was determined. The curve represents the best fit to Equation 4 with a burst amplitude of 8.52 ± 0.30 μM, a burst rate of 48.6 ± 6.1 sec−1, and a steady-state rate of 0.09 ± 0.01 sec−1. For comparison, the time course for the reaction of ALAS (30 μM) (open triangles) preincubated with glycine (200 mM) with succinyl-CoA (150 μM) at 20°C is included (from Zhang and Ferreira 2002).
Figure 5.
Figure 5.
Reaction of 2XALAS (A) (12.5 μM) or ALAS (B) (50 μM), preincubated with glycine (200 mM), with succinyl-CoA (120 μM) at pH 7.5 and 30°C. (A,B) Selected pre-steady-state spectra from the 2000 spectra collected during the reaction. The concentrations shown in parentheses are final concentrations after mixing. (C) Time courses of the (1) 2XALAS-and (2) ALAS-catalyzed reactions at 510 nm. The time course data were best fitted to Equation 5 for a two-exponential process (see Materials and Methods). An increase, defined by formula image in the accumulated 510 nm-absorbing species (or EQ2) of 4.1 was associated with the 2XALAS-catalyzed reaction. [E]0 represents the initial enzyme active site concentration.
Scheme 1.
Scheme 1.

References

    1. Ahktar, M. and Jordan, P.M. 1979. In Comprehensive organic chemistry: The synthesis and reaction of organic compounds (ed. E. Haslam), 1st ed., pp. 1121–1144. Pergamon Press, New York.
    1. Ahmed, S.A., McPhie, P., and Miles, E.W. 1996. A thermally induced reversible conformational transition of the tryptophan synthase b2 subunit probed by the spectroscopic properties of pyridoxal phosphate and by enzymatic activity. J. Biol. Chem. 271 8612–8617. - PubMed
    1. Alexander, F.W., Sandmeier, E., Mehta, P.K., and Christen, P. 1994. Evolutionary relationships among pyridoxal-5′-phosphate-dependent enzymes. Regio-specific α, β and γ families. Eur. J. Biochem. 219 953–960. - PubMed
    1. Alexeev, D., Alexeeva, M., Baxter, R.L., Campopiano, D.J., Webster, S.P., and Sawyer, L. 1998. The crystal structure of 8-amino-7-oxononanoate synthase: A bacterial PLP-dependent, acyl-CoA-condensing enzyme. J. Mol. Biol. 284 401–419. - PubMed
    1. Bertoldi, M., Cellini, B., Clausen, T., and Voltattorni, C.B. 2002. Spectroscopic and kinetic analyses reveal the pyridoxal 5′-phosphate binding mode and the catalytic features of Treponema denticola cystalysin. Biochemistry 41 9153–9164. - PubMed

Publication types

MeSH terms

Substances