. 2005 May;115(5):1333-42.
doi: 10.1172/JCI23915. Epub 2005 Apr 7.

Targeted inactivation of hepatic Abca1 causes profound hypoalphalipoproteinemia and kidney hypercatabolism of apoA-I

Affiliations

Targeted inactivation of hepatic Abca1 causes profound hypoalphalipoproteinemia and kidney hypercatabolism of apoA-I

Jenelle M Timmins et al. J Clin Invest. 2005 May.

Abstract

Patients with Tangier disease exhibit extremely low plasma HDL concentrations resulting from mutations in the ATP-binding cassette, sub-family A, member 1 (ABCA1) protein. ABCA1 controls the rate-limiting step in HDL particle assembly by mediating efflux of cholesterol and phospholipid from cells to lipid-free apoA-I, which forms nascent HDL particles. ABCA1 is widely expressed; however, the specific tissues involved in HDL biogenesis are unknown. To determine the role of the liver in HDL biogenesis, we generated mice with targeted deletion of the second nucleotide-binding domain of Abca1 in liver only (Abca1(-L/-L)). Abca1(-L/-L) mice had total plasma and HDL cholesterol concentrations that were 19% and 17% those of wild-type littermates, respectively. In vivo catabolism of HDL apoA-I from wild-type mice or human lipid-free apoA-I was 2-fold higher in Abca1(-L/-L) mice compared with controls due to a 2-fold increase in the catabolism of apoA-I by the kidney, with no change in liver catabolism. We conclude that in chow-fed mice, the liver is the single most important source of plasma HDL. Furthermore, hepatic, but not extrahepatic, Abca1 is critical in maintaining the circulation of mature HDL particles by direct lipidation of hepatic lipid-poor apoA-I, slowing its catabolism by the kidney and prolonging its plasma residence time.


Figures

Figure 1
Figure 1
Targeting strategy and genotypic analysis of liver-specific Abca1-knockout mice. (A) Schematic of 3′ region (exons 44–49) of Abca1 gene showing wild-type (top), floxed (middle), and knockout (bottom) Abca1 alleles. Three loxP sites, 2 flanking the neomycin (Neo) resistance gene and 1 in intron 46, are shown as arrowheads. Arrows below the floxed allele indicate relative position of primers used for PCR screen of alleles. The size of the EcoRV (RV) fragment is shown above each allele, and the relative location of the probe used for Southern blot analysis is shown above the wild-type allele (Probe A). Cre recombinase–mediated elimination of exons 45 and 46 will delete the second ATP-binding cassette, resulting in a knockout allele. Restriction sites: Bg2, Bgl II; E, EcoRI; H, HindIII; S, SacI. (B) Southern blot analysis of liver (L) and kidney (K) genomic DNA from mice that inherited both the Cre and wild-type or floxed Abca1 alleles. DNA was digested with EcoRV and hybridized with probe A. –L denotes a liver-specific knockout allele. (C) Quantitative real-time PCR analysis of RNA isolated from liver and kidney. Relative fold change compared with a wild-type (+/+) liver sample was calculated using the 2–ØØCT method (42). (D) Western blot analysis of liver membranes isolated from 3 mice of the indicated Abca1 genotypes. (E) Multi-tissue Southern blot of genomic DNA from the indicated tissues from a wild-type and liver-specific knockout (–L/–L) mouse.
Figure 2
Figure 2
Lipid efflux from primary hepatocytes and peritoneal macrophages. Primary mouse hepatocytes were isolated from chow-fed Abca1+/+ or Abca1–L/–L mice, stimulated with 9-cis-retanoic acid and 22-OH-cholesterol, and radiolabeled with either [3H]cholesterol or [14C]choline chloride for 24 hours. After an hour of equilibration, cells were incubated in the presence or absence of 10 μg apoA-I/ml for 24 hours. (A) Hepatocyte cholesterol efflux in the presence or absence of apoA-I. (B) Hepatocyte choline PL efflux in the presence or absence of apoA-I. Data with unlike symbols are significantly different from one another (P < 0.05). (C) Thioglycolate-elicited peritoneal macrophages were isolated from Abca1+/+ or Abca1–L/–L mice, radiolabeled with [3H]cholesterol for 24 hours, and then incubated with 10 μM T0901317 or vehicle for an additional 24 hours. Cholesterol efflux was measured after 24-hour incubation of cells, which were stimulated with T0901317 or vehicle in the presence or absence of 20 μg apoA-I/ml. Radiolabel in medium and the cellular isopropanol extract was quantified, and percentage efflux was calculated as the ratio of radioactivity in the medium divided by total radioactivity (cells + media) × 100%. Data are mean ± SD for 3 mice of the indicated genotypes, assayed in triplicate. (D) Western blot of Abca1 or load control protein (GAPDH or β-actin) in cultured hepatocytes (top) or cultured elicited macrophages (bottom).
Figure 3
Figure 3
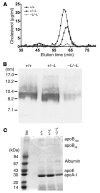
Plasma lipoprotein and apolipoprotein characterization of liver-specific Abca1-knockout mice. Plasma was obtained from chow-fed Abca1+/+, Abca1+/–L, and Abca1–L/–L mice fasted for 4 hours. Equal-volume pools of plasma were made using 5 mice of each genotype for FPLC (A) and apolipoprotein analysis (C). (A) One hundred microliters whole plasma from each pool was fractionated on Superose 6 FPLC columns. Fractions were collected at 1-minute intervals, and total cholesterol was measured using an enzymatic assay. (B) One microliter of whole plasma from 3 individual mice of each genotype was fractionated on a 4–30% nondenaturing gradient gel for 1,400 V/h. The proteins were transferred to nitrocellulose, and the blot was developed with anti-mouse apoA-I antiserum. (C) Pooled plasma from each genotype was subjected to ultracentrifugation at a density of 1.25 g/ml to float plasma lipoproteins. Fifteen micrograms of lipoprotein protein was added to each lane of the gel, and apolipoproteins were separated by 4–16% SDS-PAGE. Gels were stained with Coomassie blue and destained to visualize the apolipoproteins. Standard low-molecular-weight markers (Std) are indicated on the left. Estimated migration position of apoB100, apoB48, albumin, apoE, and apoA-I are indicated on the right.
Figure 4
Figure 4
Hepatic Abca1 protein expression and plasma HDL cholesterol concentrations in liver-specific Abca1-knockout mice. Liver membranes were isolated from a subset of mice of the indicated genotypes that were allowed to consume chow. Membranes were fractionated by SDS-PAGE, after which proteins were transferred to nitrocellulose membranes and probed with primary antibody to Abca1 or β-actin. Blots were developed using a 125I-radiolabeled secondary antibody, and PhosphorImager analysis was then used to quantify the signal intensity ratio of Abca1 to β-actin (A). HDL cholesterol concentrations in plasma were measured by enzymatic assay after precipitation of apoB lipoproteins with heparin and MnCl2 (B). Points represent data from individual mice, and the horizontal lines denote the mean for each genotype.
Figure 5
Figure 5
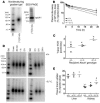
In vivo catabolism of wild-type HDL tracer in Abca1+/+, Abca1+/–L, and Abca1–L/–L recipient mice. HDL particles were isolated from the plasma of chow-fed wild-type mice, radiolabeled with [125I]TC, a residualizing reagent, and injected into chow-fed mice of the indicated genotype. Plasma samples were taken over 24 hours, after which animals were sacrificed, and tissues were harvested for quantification of radiolabel uptake. In C and E, genotypes with unlike symbols are significantly different from one another (P < 0.05). (A) Characterization of [125I]TC HDL tracer by 4–30% nondenaturing gradient gel electrophoresis and 4–16% SDS-PAGE. Both gels were visualized by PhosphorImager analysis. Standard proteins are shown for reference. (B) Whole plasma die-away of wild-type HDL tracer in Abca1+/+, Abca1+/–L, and Abca1–L/–L mice. Individual data points are mean ± SD (n = 3). (C) Tracer FCR calculated from the plasma die-away curves in B. The horizontal lines denote the mean for each genotype. (D) Size analysis of [125I]TC HDL tracer in plasma after injection into Abca1+/+ and Abca1–L/–L recipient mice. Plasma samples were collected at the indicated times from recipient mice injected with [125I]TC HDL and separated on 4–30% nondenaturing gradient PAGE. [125I]TC HDL migration was visualized by PhosphorImager analysis. (E) Liver and kidney uptake of [125I]TC HDL tracer 24 hours after injection into Abca1+/+, Abca1+/–L, Abca1–L/–L mice. Liver (including intestine and contents; ref. 30) and kidney tissue was digested overnight in 1 N NaOH at 60°C, and 125I radioactivity in the digest was quantified using a γ-ray counter.
Figure 6
Figure 6
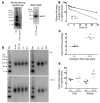
In vivo catabolism of human lipid-free apoA-I tracer in Abca1+/+ and Abca1–L/–L recipient mice. apoA-I was isolated from human plasma, radiolabeled with [125I]TC, and injected into chow-fed mice of the indicated genotype. Details are presented in the Figure 5 legend. (A) PhosphorImager analysis of [125I]TC apoA-I tracer after separation by 4–30% nondenaturing gradient gel electrophoresis and 4–16% SDS-PAGE. (B) Whole plasma die-away of lipid-free apoA-I tracer in Abca1+/+ and Abca1–L/–L mice. Individual data points are mean ± SD (n = 4). (C) Tracer FCR calculated from the plasma die-away curves in B. The horizontal lines denote the mean for each genotype. (D) Size analysis of [125I]TC apoA-I tracer in plasma after injection into Abca1+/+ and Abca1–L/–L recipient mice. (E) Liver and kidney uptake of [125I]TC apoA-I tracer 24 hours after injection into Abca1+/+ and Abca1–L/–L mice. Liver and kidney tissue was digested overnight in 1 N NaOH at 60°C, and 125I radioactivity in the digest was quantified using a γ-ray counter. Genotypes with unlike symbols are significantly different from one another (P < 0.001).

Similar articles

Cited by

References

    1. Assmann G, Gotto AM., Jr HDL cholesterol and protective factors in atherosclerosis. Circulation. 2004;109(Suppl. 1):III8–III14. - PubMed
    1. Glomset JA. The plasma lecithin:cholesterol acyltransferase reaction. J. Lipid Res. 1968;9:155–167. - PubMed
    1. Hamilton RL, Moorehouse A, Havel RJ. Isolation and properties of nascent lipoproteins from highly purified rat hepatocytic Golgi fractions. J. Lipid Res. 1991;32:529–543. - PubMed
    1. Hamilton RL, Guo LS, Felker TE, Chao YS, Havel RJ. Nascent high density lipoproteins from liver perfusates of orotic acid-fed rats. J. Lipid Res. 1986;27:967–978. - PubMed
    1. Oram JF, Yokoyama S. Apolipoprotein-mediated removal of cellular cholesterol and phospholipids. J. Lipid Res. 1996;37:2473–2491. - PubMed

Publication types

Substances