Review
. 2005 Apr;10(2):211-23.
doi: 10.1111/j.1542-474X.2005.05588.x.

ECG repolarization waves: their genesis and clinical implications

Affiliations
Review

ECG repolarization waves: their genesis and clinical implications

Thinn Hlaing et al. Ann Noninvasive Electrocardiol. 2005 Apr.

Abstract

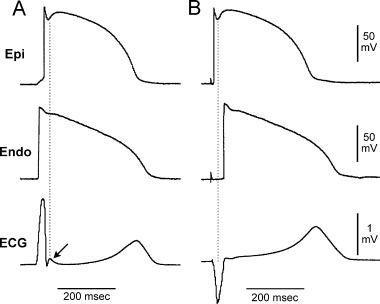
The electrocardiographic (ECG) manifestation of ventricular repolarization includes J (Osborn), T, and U waves. On the basis of biophysical principles of ECG recording, any wave on the body surface ECG represents a coincident voltage gradient generated by cellular electrical activity within the heart. The J wave is a deflection with a dome that appears on the ECG after the QRS complex. A transmural voltage gradient during initial ventricular repolarization, which results from the presence of a prominent action potential notch mediated by the transient outward potassium current (I(to)) in epicardium but not endocardium, is responsible for the registration of the J wave on the ECG. Clinical entities that are associated with J waves (the J-wave syndrome) include the early repolarization syndrome, the Brugada syndrome and idiopathic ventricular fibrillation related to a prominent J wave in the inferior leads. The T wave marks the final phase of ventricular repolarization and is a symbol of transmural dispersion of repolarization (TDR) in the ventricles. An excessively prolonged QT interval with enhanced TDR predisposes people to develop torsade de pointes. The malignant "R-on-T" phenomenon, i.e., an extrasystole that originates on the preceding T wave, is due to transmural propagation of phase 2 reentry or phase 2 early afterdepolarization. A pathological "U" wave as seen with hypokalemia is the consequence of electrical interaction among ventricular myocardial layers at action potential phase 3 of which repolarization slows. A physiological U wave is thought to be due to delayed repolarization of the Purkinje system.


Figures

Figure 1
Figure 1
Effect of ventricular activation sequence on the J wave on the ECG. (A) When the wedge preparation is stimulated from the endocardial surface with epicardium activated last, a J wave on the ECG is temporally aligned with Ito‐mediated epicardial action potential notch. (B) When the preparation is paced from the epicardial surface with endocardium activated last, the epicardial action potential notch is coincident with the QRS, and a J wave is no longer observed (reprinted from Ref. 9 with permission).
Figure 2
Figure 2
Loss of Ito‐mediated epicardial action potential dome and ST segment elevation. Upper panel: Simultaneous recordings of a transmural ECG and transmembrane action potentials from one endocardial (Endo) and two epicardial (Epi 1 and Epi 2) sites. Loss of Ito‐mediated epicardial action potential dome induced by pinacidil leads to ST segment elevation. The 4‐aminopyridine (4‐AP), a specific Ito blocker, restores epicardial dome thus normalizing ST segment. Lower panel: Ventricular fibrillation is initiated by a closely coupled R‐on‐T ectopic beat via phase 2 reentry due to complete loss of epicardial dome at Epi 2 but not at Epi 1 (reprinted from Ref.11 with permission).
Figure 3
Figure 3
Cellular basis for the early repolarization syndrome. (A) Surface ECG (lead V5) recorded from a 17‐year‐old healthy African‐American man. Note the presence of a small J wave and marked ST segment elevation. (B) Simultaneous recording of transmembrane action potentials from epicardial (Epi) and endocardial (Endo) regions and a transmural ECG in an isolated arterially perfused canine left ventricular wedge. A J wave in the transmural ECG is present due to the action potential notch in the epicardium but not the endocardium. Perfusion of the preparation with pinacidil (2 μmol/l), an ATP‐sensitive potassium channel opener, causes partial loss of the action potential dome in the epicardium, resulting in ST segment elevation in the ECG resembling the early repolarization syndrome.
Figure 4
Figure 4
Upper Panel: Twelve‐lead ECG recorded from a 29‐year‐old Asian man who survived cardiac arrest. Prominent J waves and ST segment elevation in inferior leads II, III, and aVF were observed. Lower Panel: The onset of VF in the same patient during his hospital stay (reprinted from Ref.10 with permission).
Figure 5
Figure 5
Effect of ventricular activation on the T wave on the ECG. (A) ECG tracing V4 was recorded from a patient in our EP lab who underwent radiofrequency (RF) ablation for his accessory pathway. In the first three beats, pre‐excitation of the ventricle was associated with a prolonged QRS complex and a small positive T wave. Immediately after the interruption of accessory conduction by RF ablation, the normalization of the QRS was associated with an increase in T wave amplitude and Tp–e interval. (B) Pacing site dependent changes in the QT and Tp–e intervals on the ECG. Pacing from right ventricular endocardium (RVEndoP, conventional pacing) yielded a QT interval of 485 ms. Immediately after switching to left ventricular epicardial pacing (LVEpiP), the QT interval prolonged to 580 ms, and the Tp–e interval also increased. (C) Cellular basis for pacing site dependent changes in the QT and TDR. The QT interval and TDR increased respectively from 284 and 43 ms to 303 ms and 67 ms when switching from the endocardial to epicardial despite no changes in APD. Panels B and C are reprinted with modifications from Ref.77 with permission.
Figure 6
Figure 6
(A) An R‐on‐T ectopic beat (arrow) initiated an episode of TdP in a patient with a markedly prolonged QT interval who had taken cisapride (reprinted from Ref.78 with permission). (B) Cisapride preferentially prolonged endocardial APD, resulting in the development of phase 2 EAD in an isolated rabbit left ventricular wedge preparation. Transmural propagation of EAD produced R‐on‐T ectopic beats (arrows) that were able to initiate TdP.

References

    1. Osborn JJ. Experimental hypothermia: Respiratory and blood pH changes in relation to cardiac function. Am J Physiol 1953;175: 389–398. - PubMed
    1. Eagle K. Images in clinical medicine. Osborn waves of hypothermia. N Engl J Med 1994;10: 680. - PubMed
    1. Sridharan MR, Horan LG. Electrocardiographic J wave of hypercalcemia. Am J Cardiol 1984;54: 672–673.DOI: 10.1016/0002-9149(84)90273-X - DOI - PubMed
    1. Kambara H, Phillips J. Long‐term evaluation of early repolarization syndrome (normal variant RS‐T segment elevation). Am J Cardiol 1976;38: 157–161.DOI: 10.1016/0002-9149(76)90142-9 - DOI - PubMed
    1. Zeppilli P, Pirrami MM, Sassara M, et al T wave abnormalities in top‐ranking athletes: Effects of isoproterenol, atropine, and physical exercise. Am Heart J 1980;100: 213–222.DOI: 10.1016/0002-8703(80)90117-9 - DOI - PubMed

Publication types