

Laser Doppler imager (LDI) scanner and intradermal injection for in vivo pharmacology in human skin microcirculation: responses to acetylcholine, endothelin-1 and their repeatability
- PMID: 15842548
- PMCID: PMC1884840
- DOI: 10.1111/j.1365-2125.2004.02344.x
Laser Doppler imager (LDI) scanner and intradermal injection for in vivo pharmacology in human skin microcirculation: responses to acetylcholine, endothelin-1 and their repeatability
Abstract
Aims: The purpose of this study was to evaluate the repeatability of forearm skin blood flow responses to intradermal injections of acetylcholine (ACh) and endothelin-1 (ET-1) using a double injection technique (DIT) and a laser Doppler imager (LDI) scanner in the human skin microcirculation.
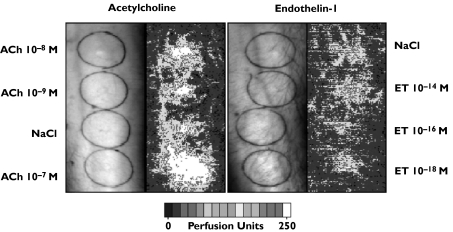
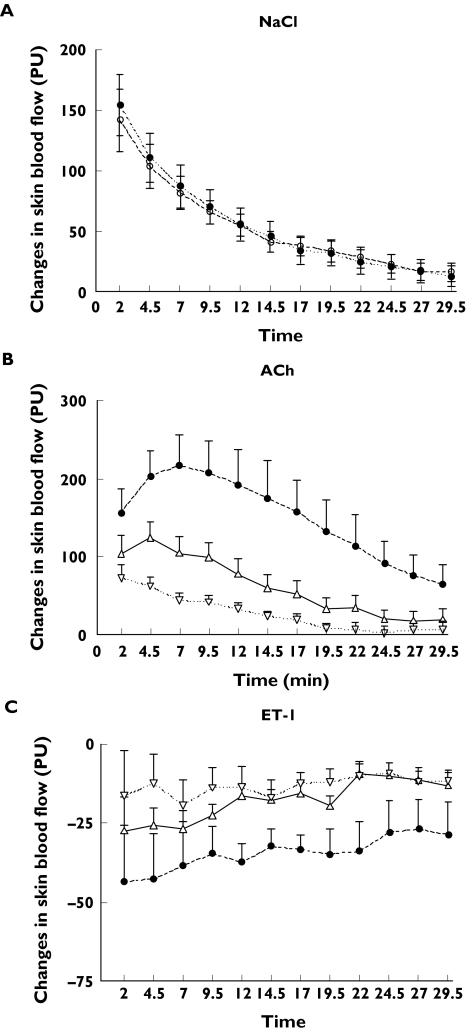
Methods: We used a laser Doppler imager (Moor LDI V3.01) to continuously monitor the change in skin blood flow during intradermal administration of physiological saline (0.9% NaCl), acetylcholine (ACh 10(-7), 10(-8), 10(-9) M) and endothelin-1 (ET-1 10(-14), 10(-16), 10(-18) M) in 10 healthy male subjects. Subjects were examined on 3 different days for assessment of interday and interobserver repeatability. Injections of either drug were randomly placed on different sites of the forearm. Laser Doppler images were collected before and after injection at 2.5 min intervals for 30 min. Data were analysed after the completion of each experiment using Moor Software V.3.01. Results are expressed as changes from baseline in arbitrary perfusion units (PU).
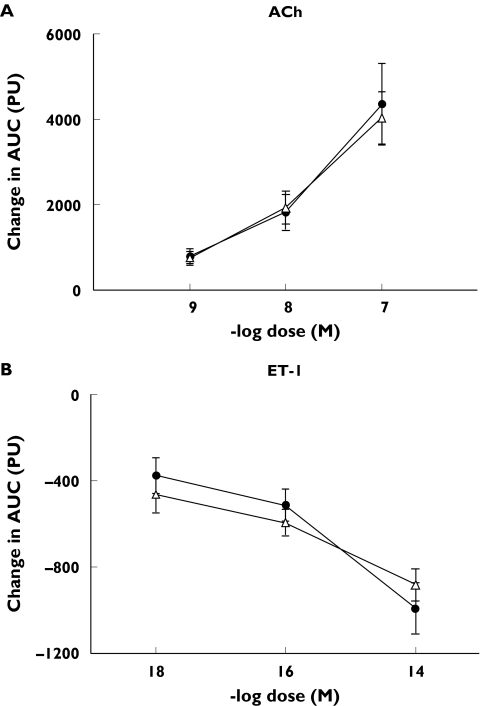
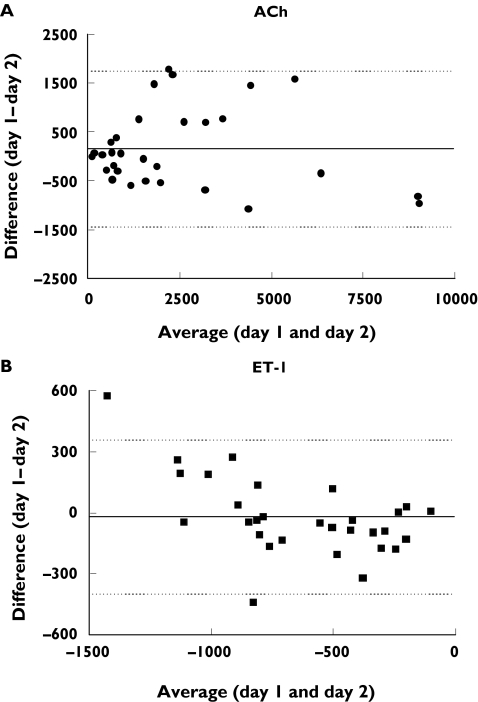
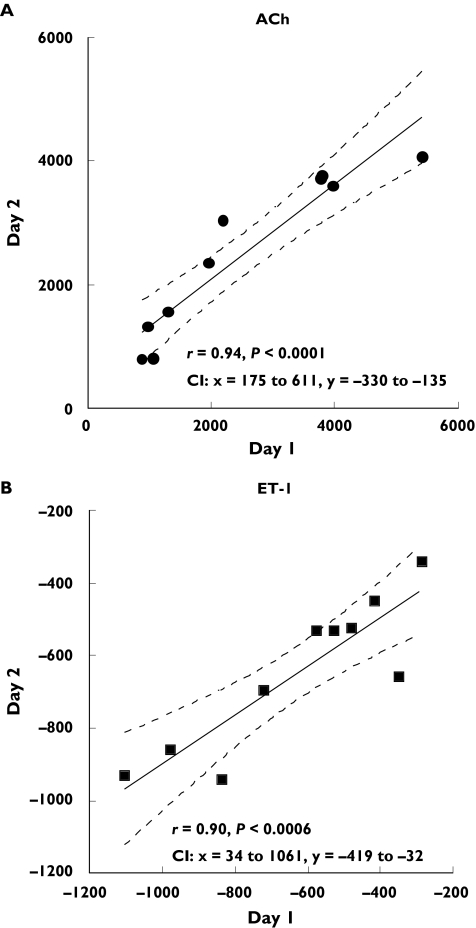
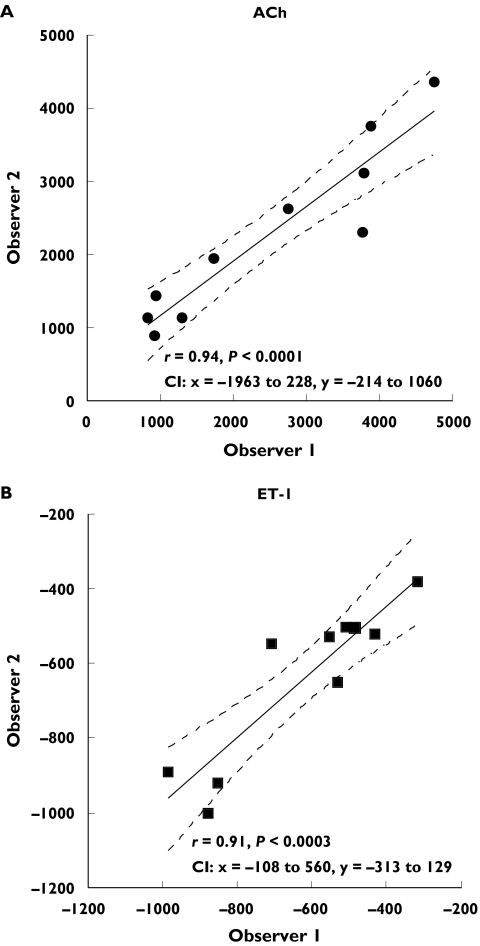
Results: ACh caused a significant vasodilation (P < 0.0001 anova, mean +/- SE: 766 +/- 152 PU, ACh 10(-9) M; 1868 +/- 360 PU, ACh 10(-8) M; 4188 +/- 848 PU, ACh 10(-7) M; mean of days 1 and 2, n = 10), and ET-1 induced a significant vasoconstrictive response (P < 0.0001 anova, -421 +/- 83 PU, ET-1 10(-18) M; -553 +/- 66 PU, ET-1 10(-16) M; -936 +/- 90 PU, ET-1 10(-14) M; mean of days 1 and 2, n = 10). There was no difference on the response to either drug on repeated days. Bland-Altman analyses showed a close agreement of responses between days with repeatability coefficients of 1625.4 PU for ACh, and 386.0 PU for ET-1 (95% CI: ACh, -1438 to 1747 PU, ET-1, -399 to 358 PU) and between observers with repeatability coefficients of 1057.2 PU for ACh and 255.8 PU for ET-1 (95% CI: ACh, -1024 to 1048 PU, ET-1, -252 to 249 PU). The variability between these responses was independent of average flux values for both ACh and ET-1. There was a significant correlation between responses measured in the same site, in the same individual on two different days by the same observer (ACh, r = 0.94, P < 0.0001; ET-1, r = 0.90, P < 0.0006), and between responses measured by two different observers (ACh, r = 0.94, P < 0.0001; ET-1, r = 0.91, P < 0.0003).
Conclusion: We have shown that interday and intraobserver responses to intradermal injections of ET-1 and ACh, assessed using the DIT in combination with an LDI scanner, exhibited good reproducibility and may be a useful tool for studying the skin microcirculation in vivo.
Figures

References
-
- Nilsson GE, Tenland T, Oberg PA. Evaluation of a laser Doppler flowmeter for measurement of tissue blood flow. IEEE Trans Biomed Eng. 1980;27(10):597–604. - PubMed
-
- Essex TJ, Byrne PO. A laser Doppler scanner for imaging blood flow in skin. J Biomed Eng. 1991;13(3):189–94. - PubMed
-
- Niazi ZB, Essex TJ, Papini R, Scott D, McLean NR, Black MJ. New laser Doppler scanner, a valuable adjunct in burn depth assessment. Burns. 1993;19(6):485–9. - PubMed
-
- Droog EJ, Steenbergen W, Sjoberg F. Measurement of depth of burns by laser Doppler perfusion imaging. Burns. 2001;27(6):561–8. - PubMed
-
- Pape SA, Skouras CA, Byrne PO. An audit of the use of laser Doppler imaging (LDI) in the assessment of burns of intermediate depth. Burns. 2001;27(3):233–9. - PubMed
Publication types
MeSH terms
Substances
LinkOut - more resources
Full Text Sources
Other Literature Sources
