

Dedifferentiation of adult human myoblasts induced by ciliary neurotrophic factor in vitro
- PMID: 15843428
- PMCID: PMC1165399
- DOI: 10.1091/mbc.e05-03-0218
Dedifferentiation of adult human myoblasts induced by ciliary neurotrophic factor in vitro
Abstract
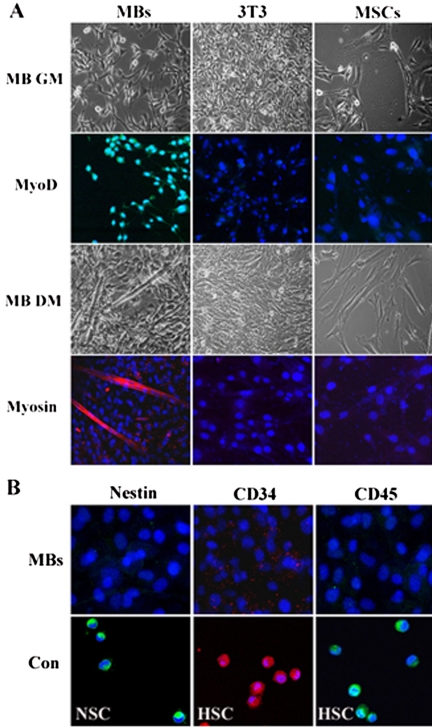
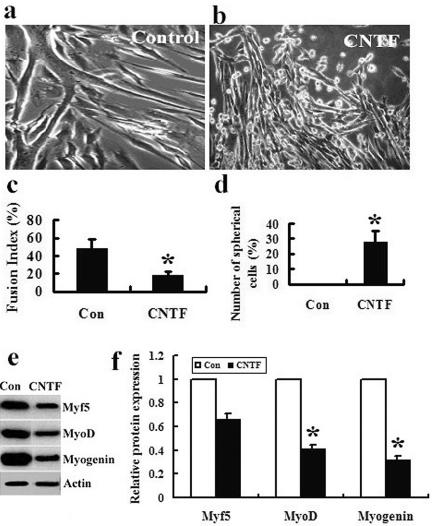
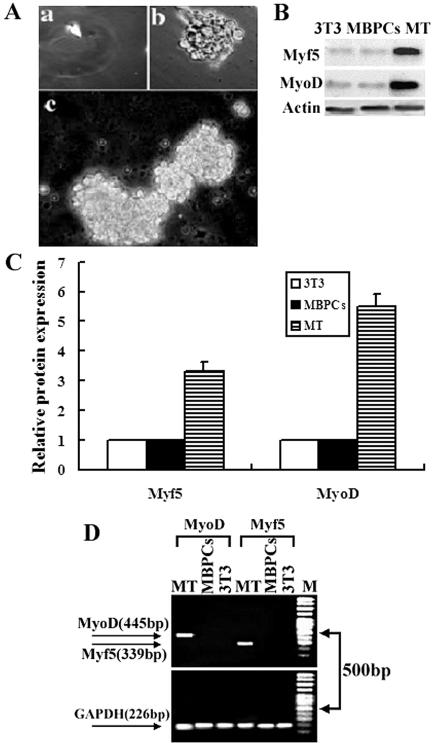
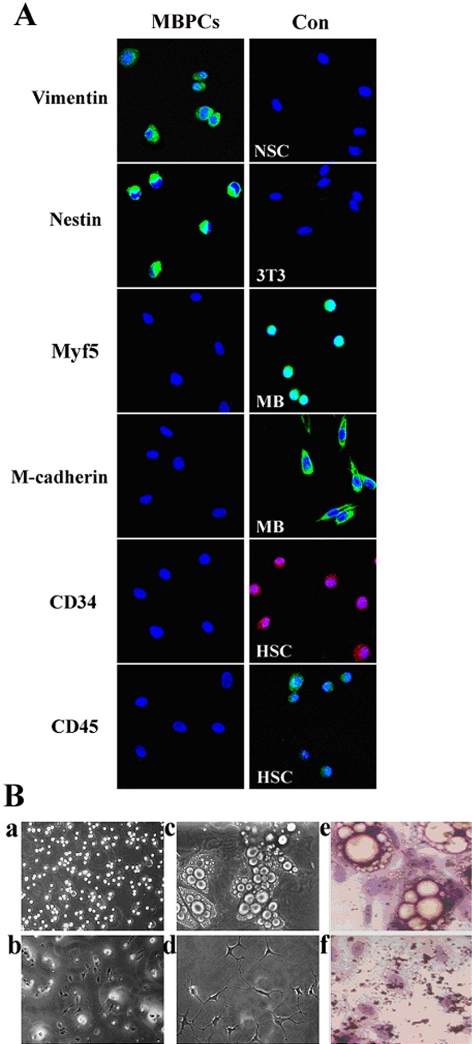
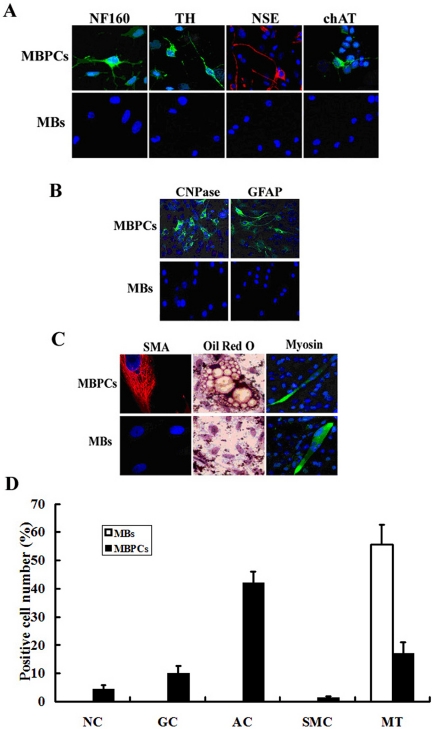
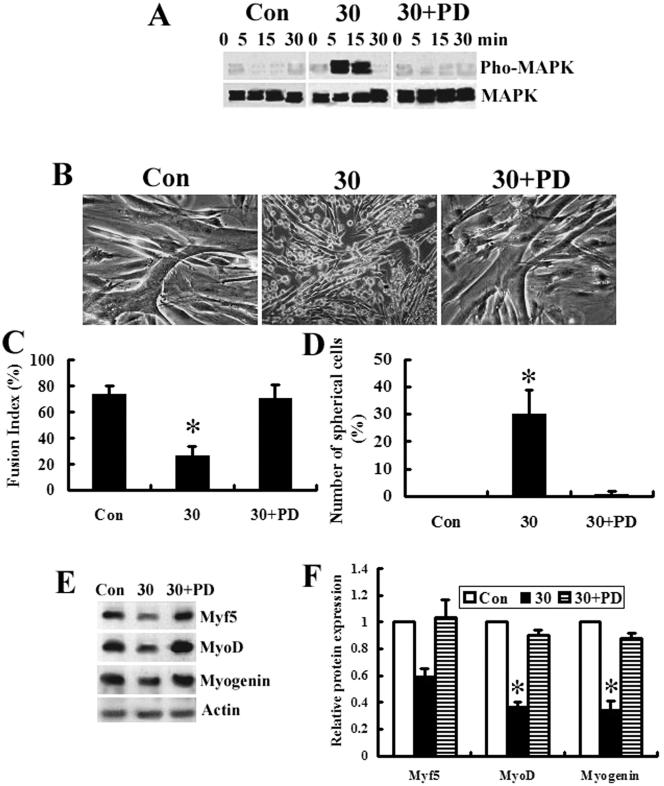
Ciliary neurotrophic factor (CNTF) is primarily known for its important cellular effects within the nervous system. However, recent studies indicate that its receptor can be highly expressed in denervated skeletal muscle. Here, we investigated the direct effect of CNTF on skeletal myoblasts of adult human. Surprisingly, we found that CNTF induced the myogenic lineage-committed myoblasts at a clonal level to dedifferentiate into multipotent progenitor cells--they not only could proliferate for over 20 passages with the expression absence of myogenic specific factors Myf5 and MyoD, but they were also capable of differentiating into new phenotypes, mainly neurons, glial cells, smooth muscle cells, and adipocytes. These "progenitor cells" retained their myogenic memory and were capable of redifferentiating into myotubes. Furthermore, CNTF could activate the p44/p42 MAPK and down-regulate the expression of myogenic regulatory factors (MRFs). Finally, PD98059, a specific inhibitor of p44/p42 MAPK pathway, was able to abolish the effects of CNTF on both myoblast fate and MRF expression. Our results demonstrate the myogenic lineage-committed human myoblasts can dedifferentiate at a clonal level and CNTF is a novel regulator of skeletal myoblast dedifferentiation via p44/p42 MAPK pathway.
Figures
Similar articles
-
Cultured myf5 null and myoD null muscle precursor cells display distinct growth defects.Biol Cell. 2000 Dec;92(8-9):565-72. doi: 10.1016/s0248-4900(00)01110-2. Biol Cell. 2000. PMID: 11374435
-
Antagonistic regulation of p57kip2 by Hes/Hey downstream of Notch signaling and muscle regulatory factors regulates skeletal muscle growth arrest.Development. 2014 Jul;141(14):2780-90. doi: 10.1242/dev.110155. Development. 2014. PMID: 25005473
-
Critical proliferation-independent window for basic fibroblast growth factor repression of myogenesis via the p42/p44 MAPK signaling pathway.J Biol Chem. 2001 Apr 27;276(17):13709-17. doi: 10.1074/jbc.M100091200. Epub 2001 Jan 25. J Biol Chem. 2001. PMID: 11279003
-
Crosstalk between cell cycle regulators and the myogenic factor MyoD in skeletal myoblasts.Cell Mol Life Sci. 2001 Apr;58(4):571-9. doi: 10.1007/PL00000882. Cell Mol Life Sci. 2001. PMID: 11361092 Free PMC article. Review.
-
Therapeutic potential of stem/progenitor cells in human skeletal muscle for cardiovascular regeneration.Curr Stem Cell Res Ther. 2007 Dec;2(4):293-300. doi: 10.2174/157488807782793808. Curr Stem Cell Res Ther. 2007. PMID: 18220913 Review.
Cited by
-
Bioengineered nerve regeneration and muscle reinnervation.J Anat. 2006 Oct;209(4):511-26. doi: 10.1111/j.1469-7580.2006.00623.x. J Anat. 2006. PMID: 17005023 Free PMC article. Review.
-
A defined long-term in vitro tissue engineered model of neuromuscular junctions.Biomaterials. 2010 Jun;31(18):4880-8. doi: 10.1016/j.biomaterials.2010.02.055. Epub 2010 Mar 25. Biomaterials. 2010. PMID: 20346499 Free PMC article.
-
Dopaminergic neuronal conversion from adult rat skeletal muscle-derived stem cells in vitro.Neurochem Res. 2012 Sep;37(9):1982-92. doi: 10.1007/s11064-012-0819-9. Epub 2012 Jun 22. Neurochem Res. 2012. PMID: 22723079
-
Genetic and Chemical Controls of Sperm Fate and Spermatocyte Dedifferentiation via PUF-8 and MPK-1 in Caenorhabditis elegans.Cells. 2023 Jan 28;12(3):434. doi: 10.3390/cells12030434. Cells. 2023. PMID: 36766775 Free PMC article.
-
Aging alters gene expression of growth and remodeling factors in human skeletal muscle both at rest and in response to acute resistance exercise.Physiol Genomics. 2008 Feb 19;32(3):393-400. doi: 10.1152/physiolgenomics.00191.2007. Epub 2007 Dec 11. Physiol Genomics. 2008. PMID: 18073271 Free PMC article.
References
-
- Aberg, M. A., Ryttsen, F., Hellgren, G., Lindell, K., Rosengren, L. E., MacLennan, A. J., Carlsson, B., Orwar, O., and Eriksson, P. S. (2001). Selective introduction of antisense oligonucleotides into single adult CNS progenitor cells using electroporation demonstrates the requirement of STAT3 activation for CNTF-induced gliogenesis. Mol. Cell Neurosci. 17, 426–443. - PubMed
-
- Adler, R., Landa, K. B., Manthorpe, M., and Varon, S. (1979). Cholinergic neuronotrophic factors. Intraocular distribution of soluble trophic activity for ciliary neurons. Science 204, 143–146. - PubMed
-
- Adi, S., Bin-Abbas, B., Wu, N. Y., and Rosenthal, S. M. (2002). Early stimulation and late inhibition of extracellular signal-regulated kinase 1/2 phosphorylation by IGF-I: a potential mechanism mediating the switch in IGF-I action on skeletal muscle cell differentiation. Endocrinology 143, 511–516. - PubMed
-
- Al-Khalili, L., Kramer, D., Wretenberg, P., and Krook, A. (2004). Human skeletal muscle cell differentiation is associated with changes in myogenic markers and enhanced insulin-mediated MAPK and PKB phosphorylation. Acta Physiol. Scand. 180, 395–403. - PubMed
-
- Asakura, A., Komaki, M., and Rudnicki, M. (2001). Muscle satellite cells are multipotential stem cells that exhibit myogenic, osteogenic, and adipogenic differentiation. Differentiation 68, 245–253. - PubMed
Publication types
MeSH terms
Substances
LinkOut - more resources
Full Text Sources
Other Literature Sources
Miscellaneous
