Comparative Study
. 2005 May 3;102(18):6478-83.
doi: 10.1073/pnas.0502088102. Epub 2005 Apr 20.

Massive nitrogen loss from the Benguela upwelling system through anaerobic ammonium oxidation

Affiliations
Comparative Study

Massive nitrogen loss from the Benguela upwelling system through anaerobic ammonium oxidation

Marcel M M Kuypers et al. Proc Natl Acad Sci U S A. .

Abstract

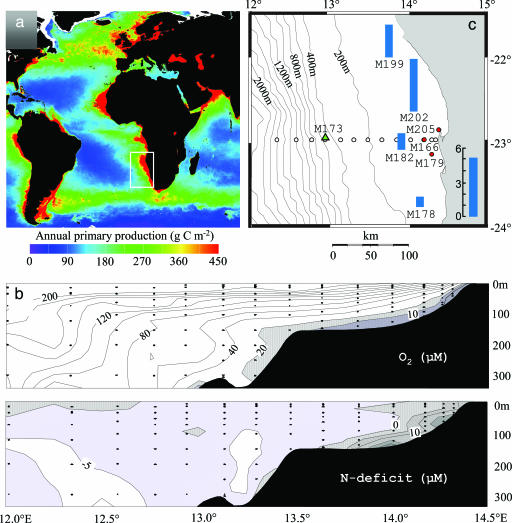
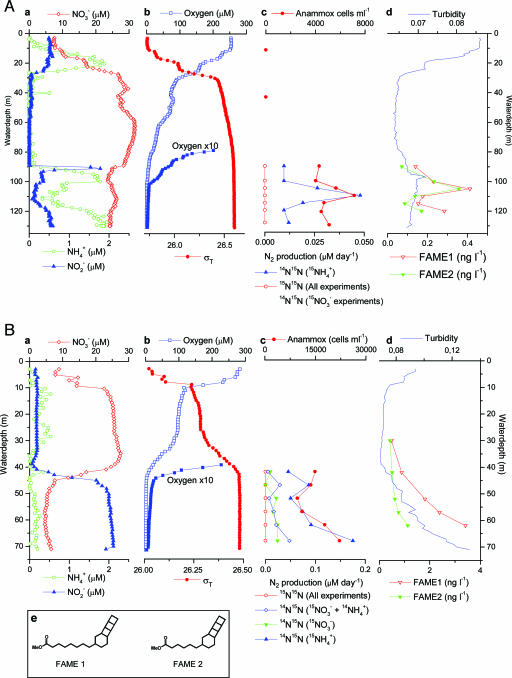
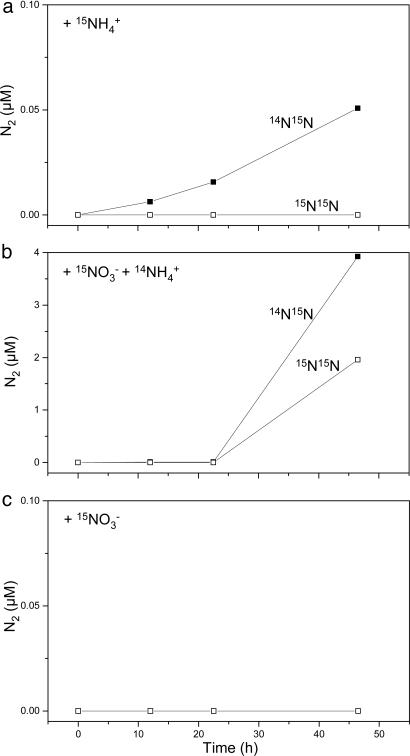
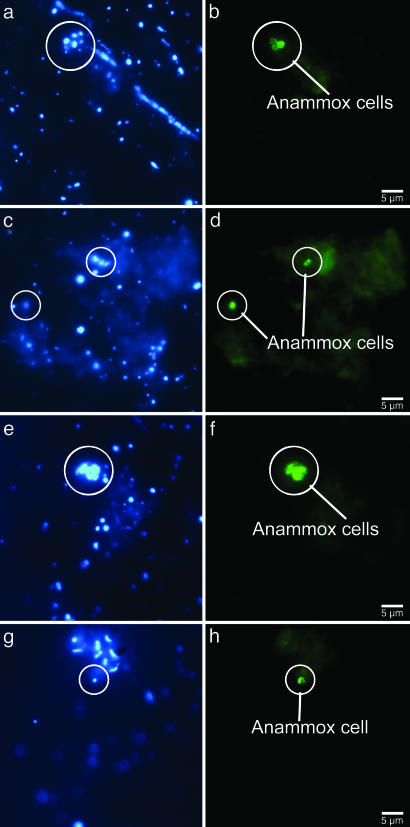
In many oceanic regions, growth of phytoplankton is nitrogen-limited because fixation of N2 cannot make up for the removal of fixed inorganic nitrogen (NH4+, NO2-, and NO3-) by anaerobic microbial processes. Globally, 30-50% of the total nitrogen loss occurs in oxygen-minimum zones (OMZs) and is commonly attributed to denitrification (reduction of nitrate to N2 by heterotrophic bacteria). Here, we show that instead, the anammox process (the anaerobic oxidation of ammonium by nitrite to yield N2) is mainly responsible for nitrogen loss in the OMZ waters of one of the most productive regions of the world ocean, the Benguela upwelling system. Our in situ experiments indicate that nitrate is not directly converted to N2 by heterotrophic denitrification in the suboxic zone. In the Benguela system, nutrient profiles, anammox rates, abundances of anammox cells, and specific biomarker lipids indicate that anammox bacteria are responsible for massive losses of fixed nitrogen. We have identified and directly linked anammox bacteria to the removal of fixed inorganic nitrogen in the OMZ waters of an open-ocean setting. We hypothesize that anammox could also be responsible for substantial nitrogen loss from other OMZ waters of the ocean.


Figures

Fig. 1.
Fig. 1.
The Benguela system. (a) Distribution of annual primary production (source: http://marine.rutgers.edu/opp/swf/Production/results/all2_swf.html). The white box indicates the extent of the Benguela upwelling system. (b) Vertical transect showing the lateral extension and fixed-inorganic-nitrogen deficit in the OMZ off Namibia at 23° south (see Nutrient Analyses in Methods). (c) Sites and nitrogen losses. The open circles represent sites used to construct the lateral transect in b. The blue bars represent the depth-integrated nitrogen loss (mmol·m-2·d-1) through anammox determined from anaerobic 15N incubations of water collected from six or seven depths throughout the suboxic zone at sites M178, M182, M199, and M202. For sites M179 and M205 (red circles) anaerobic 15N incubations indicate anammox activity, but rates were not measured. The integrated nitrogen loss for site M166 (red circle) is not shown because anaerobic 15N incubations were performed for only one depth (107 m, Fig. 4). Anammox activity was undetectable at site M173 (green triangle), where oxygen concentrations in the bottom waters exceed 20 μM.
Fig. 2.
Fig. 2.
Chemical zonation and distribution of anammox indicators at sites M182 on March 21, 2003 (A) and M202 on March 27, 2003 (B). (a) Concentrations of fixed inorganic nitrogen species. (b) Water density (σT, the density of seawater in kg·m-3 - 1,000) and oxygen concentrations (notice the 10-fold expanded O2 gradient). (c) Anammox cells per milliliter and rates of production of N2. The isotopic species pertain to the incubations indicated. At M182, production of 15N15N in all incubations and of 14N15N with added formula image and formula image or with added formula image was undetectable. Accordingly, all are represented by a single line. (d) Turbidity and depth distributions of membrane lipids specific for anammox bacteria. FAME, fatty acid methyl ester. (e) Molecular structures of the two ladderane fatty acid methyl esters represented in d.
Fig. 3.
Fig. 3.
Changes in concentrations of isotopically labeled N2 species vs. time during incubations of samples from a depth of 68 m at site M202.
Fig. 4.
Fig. 4.
Changes in concentrations of isotopically labeled N2 species vs. time during incubations of samples from a depth of 107 m at site M166.
Fig. 5.
Fig. 5.
In situ identification of aggregate-associated anammox cells (encircled) from station M202 (62 m). Single xy images of the same section were combined. (a, c, e, and g) Micrographs show aggregates stained with DAPI. (b, d, f, and h) Micrographs show results of hybridization with an oligonucleotide probe (AmxBS820) specific for anammox bacteria.

Similar articles

Cited by

References

    1. Copin-Montegut, C. & Copin-Montegut, G. (1983) Deep-Sea Res. 30, 31-46.
    1. Toggweiler, J. R. (1999) Nature 400, 511-512.
    1. Redfield, A. C., Ketchum, B. H. & Richards, F. A. (1963) in The Sea, ed. Hill, M. N. (Interscience, New York), Vol. 2, pp. 26-77.
    1. Devol, A. H. (2003) Nature 422, 575-576. - PubMed
    1. Richards, F. A. (1965) in Chemical Oceanography, eds. Ripley, J. P. & Skirrow, G. (Academic, London), pp. 611-645.

Publication types

MeSH terms