

Unmasking group III metabotropic glutamate autoreceptor function at excitatory synapses in the rat CNS
- PMID: 15845577
- PMCID: PMC1464548
- DOI: 10.1113/jphysiol.2005.086736
Unmasking group III metabotropic glutamate autoreceptor function at excitatory synapses in the rat CNS
Abstract
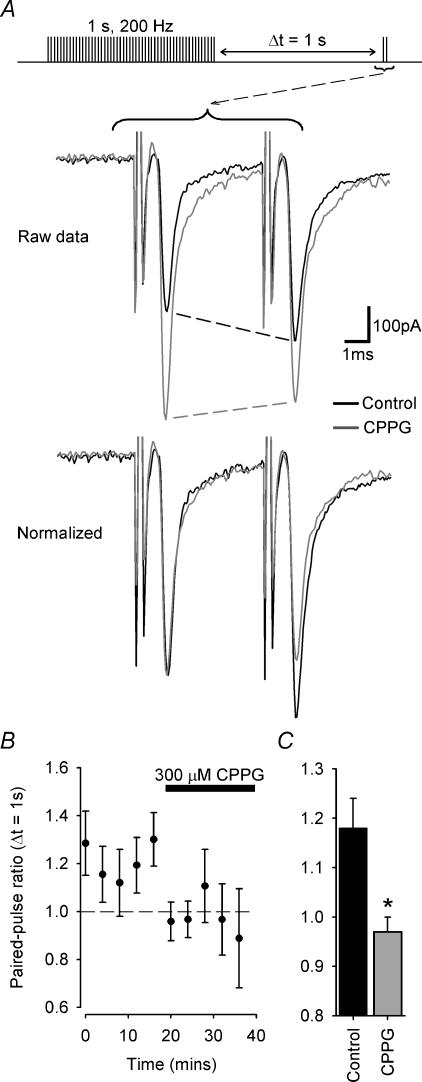
Presynaptic group III metabotropic glutamate receptor (mGluR) activation by exogenous agonists (such as L-2-amino-4-phosphonobutyrate (L-AP4)) potently inhibit transmitter release, but their autoreceptor function has been questioned because endogenous activation during high-frequency stimulation appears to have little impact on synaptic amplitude. We resolve this ambiguity by studying endogenous activation of mGluRs during trains of high-frequency synaptic stimuli at the calyx of Held. In vitro whole-cell patch recordings were made from medial nucleus of the trapezoid body (MNTB) neurones during 1 s excitatory postsynaptic current (EPSC) trains delivered at 200 Hz and at 37 degrees C. The group III mGluR antagonist (R,S)-cyclopropyl-4-phosphonophenylglycine (CPPG, 300 microm) had no effect on EPSC short-term depression, but accelerated subsequent recovery time course (tau: 4.6 +/- 0.8 s to 2.4 +/- 0.4 s, P = 0.02), and decreased paired pulse ratio from 1.18 +/- 0.06 to 0.97 +/- 0.03 (P = 0.01), indicating that mGluR activation reduced release probability (P). Modelling autoreceptor activation during repetitive stimulation revealed that as P declines, the readily releasable pool size (N) increases so that the net EPSC (NP) is unchanged and short-term depression proceeds with the same overall time course as in the absence of autoreceptor activation. Thus, autoreceptor action on the synaptic response is masked but the synapse is now in a different state (lower P, higher N). While vesicle replenishment clearly underlies much of the recovery from short-term depression, our results show that the recovery time course of P also contributes to the reduced response amplitude for 1-2 s. The results show that passive equilibration between N and P masks autoreceptor modulation of the EPSC and suggests that mGluR autoreceptors function to change the synaptic state and distribute metabolic demand, rather than to depress synaptic amplitude.
Figures


Similar articles
-
Presynaptic depression at a calyx synapse: the small contribution of metabotropic glutamate receptors.J Neurosci. 1997 Nov 1;17(21):8137-46. doi: 10.1523/JNEUROSCI.17-21-08137.1997. J Neurosci. 1997. PMID: 9334389 Free PMC article.
-
Pre- and postsynaptic glutamate receptors at a giant excitatory synapse in rat auditory brainstem slices.J Physiol. 1995 Oct 15;488 ( Pt 2)(Pt 2):387-406. doi: 10.1113/jphysiol.1995.sp020974. J Physiol. 1995. PMID: 8568678 Free PMC article.
-
Group III metabotropic glutamate receptors as autoreceptors in the cerebellar cortex.Br J Pharmacol. 2003 Feb;138(4):614-25. doi: 10.1038/sj.bjp.0705099. Br J Pharmacol. 2003. PMID: 12598415 Free PMC article.
-
Pharmacology of the metabotropic glutamate receptor mediated current at the climbing fiber to Purkinje cell synapse.Prog Brain Res. 2005;148:299-306. doi: 10.1016/S0079-6123(04)48023-6. Prog Brain Res. 2005. PMID: 15661198 Review.
-
Vesicle pools and short-term synaptic depression: lessons from a large synapse.Trends Neurosci. 2002 Apr;25(4):206-12. doi: 10.1016/s0166-2236(02)02139-2. Trends Neurosci. 2002. PMID: 11998689 Review.
Cited by
-
Superpriming of synaptic vesicles as a common basis for intersynapse variability and modulation of synaptic strength.Proc Natl Acad Sci U S A. 2016 Aug 2;113(31):E4548-57. doi: 10.1073/pnas.1606383113. Epub 2016 Jul 18. Proc Natl Acad Sci U S A. 2016. PMID: 27432975 Free PMC article.
-
Kv3.3 subunits control presynaptic action potential waveform and neurotransmitter release at a central excitatory synapse.Elife. 2022 May 5;11:e75219. doi: 10.7554/eLife.75219. Elife. 2022. PMID: 35510987 Free PMC article.
-
A Light-Controlled Allosteric Modulator Unveils a Role for mGlu4 Receptors During Early Stages of Ischemia in the Rodent Cerebellar Cortex.Front Cell Neurosci. 2018 Nov 27;12:449. doi: 10.3389/fncel.2018.00449. eCollection 2018. Front Cell Neurosci. 2018. PMID: 30542267 Free PMC article.
-
Anatomy and Physiology of Metabotropic Glutamate Receptors in Mammalian and Avian Auditory System.HSOA Trends Anat Physiol. 2018;1:001. doi: 10.24966/TAP-7752/100001. Epub 2018 Feb 9. HSOA Trends Anat Physiol. 2018. PMID: 30854519 Free PMC article.
-
Glucose and lactate as metabolic constraints on presynaptic transmission at an excitatory synapse.J Physiol. 2018 May 1;596(9):1699-1721. doi: 10.1113/JP275107. Epub 2018 Mar 26. J Physiol. 2018. PMID: 29430661 Free PMC article.
References
-
- Abbott LF, Varela JA, Sen K, Nelson SB. Synaptic depression and cortical gain control. Science. 1997;275:220–224. - PubMed
-
- Anwyl R. Metabotropic glutamate receptors: electrophysiological properties and role in plasticity. Brain Res Brain Res Rev. 1999;29:83–120. - PubMed
-
- Attwell D, Laughlin SB. An energy budget for signaling in the grey matter of the brain. J Cereb Blood Flow Metab. 2001;21:1133–1145. - PubMed
Publication types
MeSH terms
Substances
Grants and funding
LinkOut - more resources
Full Text Sources
Miscellaneous