. 2005 Jun 15;565(Pt 3):709-15.
doi: 10.1113/jphysiol.2005.086561. Epub 2005 Apr 21.

Role of extracellular Ca2+ in gating of CaV1.2 channels

Affiliations

Role of extracellular Ca2+ in gating of CaV1.2 channels

Olga Babich et al. J Physiol. .

Abstract

We examined changes in ionic and gating currents in Ca(V)1.2 channels when extracellular Ca(2+) was reduced from 10 mm to 0.1 microm. Saturating gating currents decreased by two-thirds (K(D) approximately 40 microm) and ionic currents increased 5-fold (K(D) approximately 0.5 microm) due to increasing Na(+) conductance. A biphasic time dependence for the activation of ionic currents was observed at low [Ca(2+)], which appeared to reflect the rapid activation of channels that were not blocked by Ca(2+) and a slower reversal of Ca(2+) blockade of the remaining channels. Removal of Ca(2+) following inactivation of Ca(2+) currents showed that Na(+) currents were not affected by Ca(2+)-dependent inactivation. Ca(2+)-dependent inactivation also induced a negative shift of the reversal potential for ionic currents suggesting that inactivation alters channel selectivity. Our findings suggest that activation of Ca(2+) conductance and Ca(2+)-dependent inactivation depend on extracellular Ca(2+) and are linked to changes in selectivity.


Figures
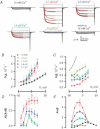
Figure 1
Figure 1. Two components of activation of Na+ currents
A, ionic currents with 150 mm Na+ and different [Ca2+] (indicated) in the extracellular solution. Voltage pulses were applied from −90 mV holding potential to −60 to +50 mV. Red lines illustrate fits by I=A(1 − exp(−kAt)) +B(1 − exp(−kBt)). Traces at 40 μm and 10 mm Ca2+ were fitted by a single exponential. B, rates of the fast component of a bi-exponential fit to activation of currents at submicromolar Ca2+ (coloured symbols) and rates of a single exponential fit to activation of currents at 10 mm Ca2+ (black symbols). The dashed line shows the rates for 10 mm Ca2+ shifted by −40 mV. C, rates of the slow component of a bi-exponential fit to activation of currents at submicromolar Ca2+ (coloured symbols) and rates of a single exponential fit to activation of currents at 40 μm Ca2+ (dark green symbols). The dashed line is the same as in B. D, relative contributions of the fast component.E, magnitudes of the fit. The magnitudes were normalized to the value at 20 mV and 10 mm Ca2+ in each cell. n = 4–7.
Figure 2
Figure 2. Effect of extracellular Ca2+ on gating currents
A, changes of gating currents at low Ca2+. Traces b are asymmetric currents recorded at 10 mm Ca2+. Traces c are for 1.35 μm Ca2+. Traces shown by thin lines were elicited at −150 mV, thick lines show traces elicited at the reversal potential for ionic currents (70 mV in b; and 25 mV in c). B, dependencies of the peak amplitude of ionic current (Imax, open symbols) and of the Qmax values (filled symbols) on [Ca2+]. Qmax values were determined as described in Supplemental material, Fig. 2. Before averaging, Imax and Qmax were normalized to their values obtained at 10 mm Ca2+ in the same cell. n = 6–16. The Imax values (except the points at 10 and 0.2 mm Ca2+) were fitted by the function I=IIKD/(KD+[Ca2+]) with parameters: I= 0.33 ± 0.06, ΔI= 5.51 ± 0.93, KD= 0.49 ± 0.08 μm. The Qmax values were fitted by the function Qmax= 1 −ΔQmaxKD/(KD+[Ca2+]) with parameters: ΔQmax= 0.68 ± 0.11, KD= 39 ± 14 μm. C, intramembrane charge movements recorded from 0 mV holding potential at 10 mm Ca2+ (b) by pulses ranging from −160 to −10 mV, and at 0.1 μm Ca2+ (c) by pulses ranging from −160 to −40 mV. Thick lines highlight traces at −160 mV. D, charge transfer functions for transients recorded as in C. Charges obtained by integration of the ON transients at different voltages were normalized in each cell to the Qmax value obtained by pulses to 70 mV from −90 mV holding potential at 10 mm Ca2+. n = 5. Parameters of the fits by the Boltzmann function at 10 mm Ca2+ are: Q−∞=−0.77 ± 0.11, Qmax= 0.97 ± 0.08, V1/2=−95 ± 7 mV, K= 27 ± 4 mV.
Figure 3
Figure 3. Na+ current was not affected by inactivation at normal Ca2+
A, restoration of Na+ current after inactivation at normal Ca2+. Traces a and c were elicited at 150 mm Na+ and 1.35 mm Ca2+. The red trace b was recorded starting at 150 mm Na+ and 10 mm Ca2+, and then Ca2+ was reduced to 1.35 μm. The dashed line is trace a scaled to the peak of trace b. B, recovery from inactivation at normal Ca2+ was not accelerated by the absence of Ca2+. Trace a was obtained at 10 mm Ca2+. [Ca2+] was changed during the pulses for trace b at the times indicated. Ca2+ current during the second pulse was not affected. Trace c was obtained at 150 mm Na+ and 1.35 μm Ca2+.
Figure 4
Figure 4. Differential effect of Ca2+-dependent inactivation at 10 mm Ca2+ on inward Ca2+ and outward Cs+ currents
A, comparison of outward currents obtained after 20 mV pre-pulses of different duration. The dotted line in b was obtained by scaling the inward current at 20 mV to go through the peak current at 100 mV after a 50 ms-long pre-pulse. B, determination of the reversal potential after inactivating pre-pulses of different duration. Tracings are shown for the second step ranging from 20 to 90 mV. The dotted line shows current elicited by a 250 ms long pre-pulse to 20 mV and the second step to 90 mV after addition of 10 μm GdCl3 to the bath. C, instantaneous current–voltage relationships after inactivating pre-pulses of different duration as shown in B. Circles plot current magnitudes measured 2 ms after the step from a 12.5 ms-long pre-pulse to 20 mV; triangles plot current magnitudes measured 2 ms after the step from a 250 ms-long pre-pulse to 20 mV. Before averaging, the values were normalized in each cell to current amplitude at 20 mV. n = 6.

References

    1. Baukrowitz T, Yellen G. Modulation of K+ current by frequency and external [K+]: a tale of two inactivation mechanisms. Neuron. 1995;15:951–960. - PubMed
    1. Brown AM, Tsuda Y, Wilson DL. A description of activation and conduction in calcium channels based on tail and turn-on current measurements in the snail. J Physiol. 1983;344:549–583. - PMC - PubMed
    1. Brum G, Fitts R, Pizarro G, Rios E. Voltage sensors of the frog skeletal muscle membrane require calcium to function in excitation-contraction coupling. J Physiol. 1988;398:475–505. - PMC - PubMed
    1. Brum G, Rios E. Intramembrane charge movement in frog skeletal muscle fibres. Properties of charge 2. J Physiol. 1987;387:489, 581–517. Erratum: J Physiol405, 581. - PMC - PubMed
    1. Carbone E, Lux HD. Single low-voltage-activated calcium channels in chick and rat sensory neurones. J Physiol. 1987;386:571–601. - PMC - PubMed

Publication types

LinkOut - more resources