

Meta-analysis of functional imaging data using replicator dynamics
- PMID: 15846812
- PMCID: PMC6871715
- DOI: 10.1002/hbm.20133
Meta-analysis of functional imaging data using replicator dynamics
Abstract
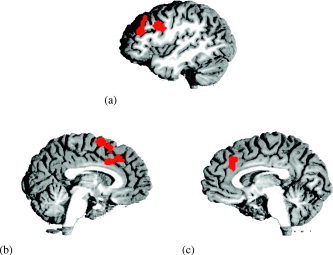
Despite the rapidly growing number of meta-analyses in functional neuroimaging, the field lacks formal mathematical tools for the quantitative and qualitative evaluation of meta-analytic data. We propose to use replicator dynamics in the meta-analysis of functional imaging data to address an important aspect of neuroimaging research, the search for functional networks of cortical areas that underlie a specific cognitive task. The replicator process requires as input only a list of activation locations, and it results in a network of locations that jointly show significant activation in most studies included in the meta-analysis. These locations are likely to play a critical role in solving the investigated cognitive task. Our method was applied to a meta-analysis of the Stroop interference task using data provided by the publicly accessible database BrainMap DBJ.
Figures


Similar articles
-
Behavior, sensitivity, and power of activation likelihood estimation characterized by massive empirical simulation.Neuroimage. 2016 Aug 15;137:70-85. doi: 10.1016/j.neuroimage.2016.04.072. Epub 2016 May 11. Neuroimage. 2016. PMID: 27179606 Free PMC article.
-
Trends in the sample size, statistics, and contributions to the BrainMap database of activation likelihood estimation meta-analyses: An empirical study of 10-year data.Hum Brain Mapp. 2023 Apr 1;44(5):1876-1887. doi: 10.1002/hbm.26177. Epub 2022 Dec 8. Hum Brain Mapp. 2023. PMID: 36479854 Free PMC article. Review.
-
Identifying functional subdivisions in the human brain using meta-analytic activation modeling-based parcellation.Neuroimage. 2016 Jan 1;124(Pt A):300-309. doi: 10.1016/j.neuroimage.2015.08.027. Epub 2015 Aug 18. Neuroimage. 2016. PMID: 26296500 Free PMC article.
-
Neural correlates of interference resolution in the multi-source interference task: a meta-analysis of functional neuroimaging studies.Behav Brain Funct. 2018 Apr 10;14(1):8. doi: 10.1186/s12993-018-0140-0. Behav Brain Funct. 2018. PMID: 29636070 Free PMC article.
-
Evaluating the consistency and specificity of neuroimaging data using meta-analysis.Neuroimage. 2009 Mar;45(1 Suppl):S210-21. doi: 10.1016/j.neuroimage.2008.10.061. Epub 2008 Nov 20. Neuroimage. 2009. PMID: 19063980 Free PMC article. Review.
Cited by
-
Childhood trauma moderates inhibitory control and anterior cingulate cortex activation during stress.Neuroimage. 2019 Jan 15;185:111-118. doi: 10.1016/j.neuroimage.2018.10.049. Epub 2018 Oct 19. Neuroimage. 2019. PMID: 30342975 Free PMC article.
-
Network localization of heterogeneous neuroimaging findings.Brain. 2019 Jan 1;142(1):70-79. doi: 10.1093/brain/awy292. Brain. 2019. PMID: 30551186 Free PMC article.
-
Coordinate-based voxel-wise meta-analysis: dividends of spatial normalization. Report of a virtual workshop.Hum Brain Mapp. 2005 May;25(1):1-5. doi: 10.1002/hbm.20139. Hum Brain Mapp. 2005. PMID: 15846826 Free PMC article. Review. No abstract available.
-
The extended language network: a meta-analysis of neuroimaging studies on text comprehension.Hum Brain Mapp. 2008 May;29(5):581-93. doi: 10.1002/hbm.20422. Hum Brain Mapp. 2008. PMID: 17557297 Free PMC article.
-
Exploring functional relations between brain regions from fMRI meta-analysis data: comments on Ramsey, Spirtes, and Glymour.Neuroimage. 2011 Jul 15;57(2):331-3. doi: 10.1016/j.neuroimage.2010.11.012. Epub 2010 Nov 12. Neuroimage. 2011. PMID: 21075207 Free PMC article.
References
-
- Bomze IM, Pelillo M, Stix V (2000): Approximating the maximum weight clique using replicator dynamics. IEEE Trans Neural Netw 11: 1228–1241. - PubMed
-
- Bouzat S, Zanette DH (2003): Survival and extinction in the replicator model: dynamics and statistics. Adv Complex Syst 6: 223–240.
-
- Chein JM, Fissell K, Jacobs S, Fiez JA (2002): Functional heterogeneity within Broca's area during verbal working memory. Physiol Behav 77: 635–639. - PubMed
-
- Crum WR, Griffina LD, Hilla DL, Hawkesa DJ (2003): Zen and the art of medical image registration: correspondence, homology, and quality. Neuroimage 20: 1425–1437. - PubMed
MeSH terms
LinkOut - more resources
Full Text Sources
Medical
