. 2005 Jul;89(1):120-9.
doi: 10.1529/biophysj.104.058388. Epub 2005 Apr 22.

Spontaneous synchronization of coupled circadian oscillators

Affiliations

Spontaneous synchronization of coupled circadian oscillators

Didier Gonze et al. Biophys J. 2005 Jul.

Abstract

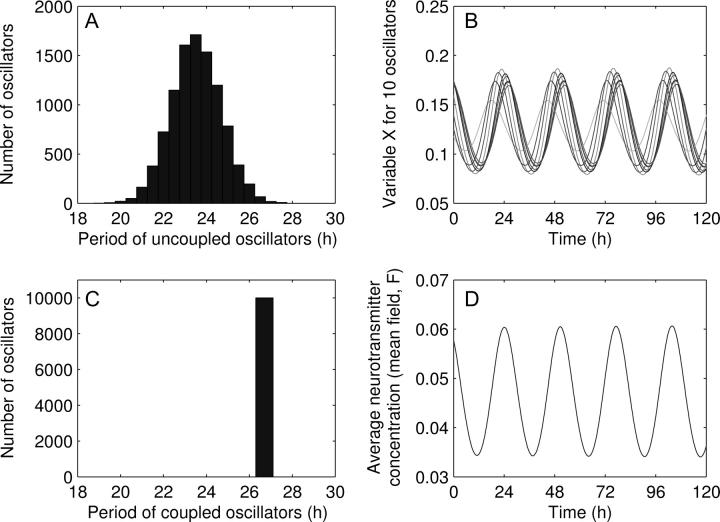
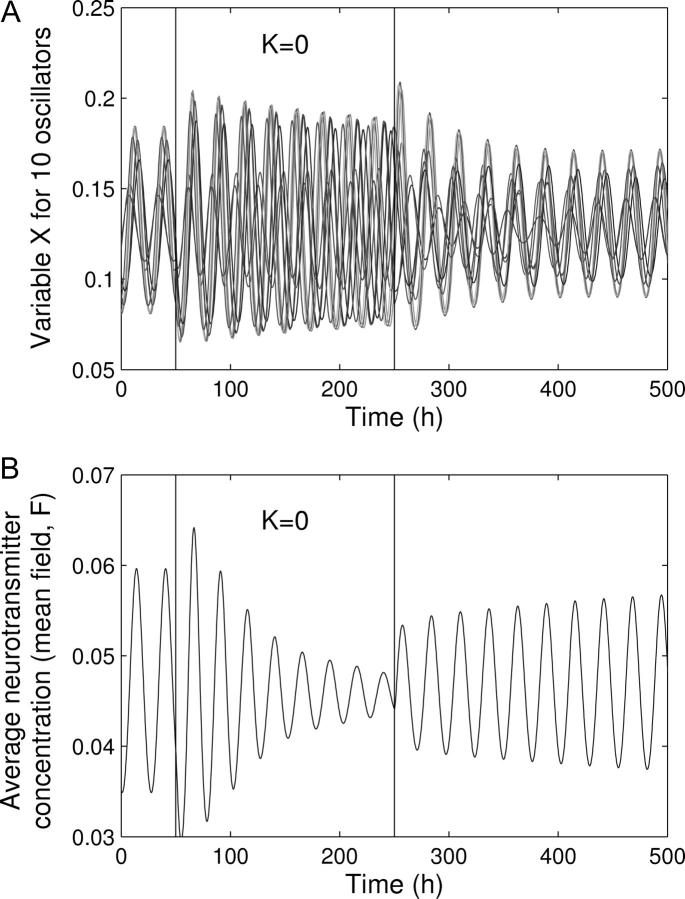
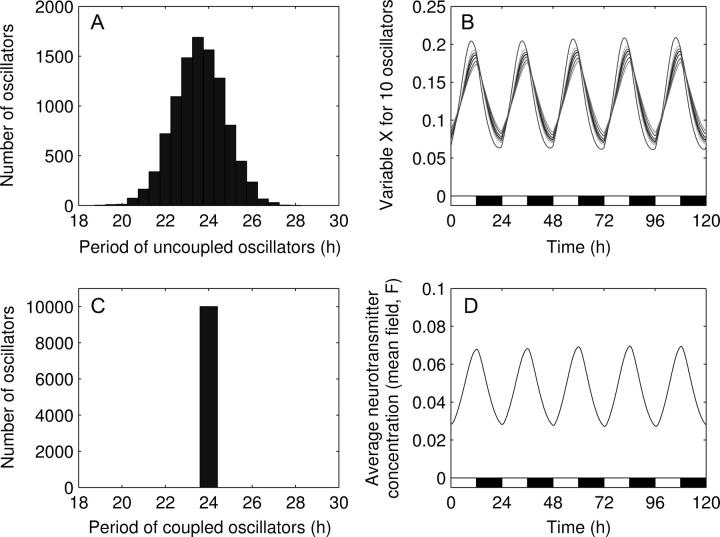
In mammals, the circadian pacemaker, which controls daily rhythms, is located in the suprachiasmatic nucleus (SCN). Circadian oscillations are generated in individual SCN neurons by a molecular regulatory network. Cells oscillate with periods ranging from 20 to 28 h, but at the tissue level, SCN neurons display significant synchrony, suggesting a robust intercellular coupling in which neurotransmitters are assumed to play a crucial role. We present a dynamical model for the coupling of a population of circadian oscillators in the SCN. The cellular oscillator, a three-variable model, describes the core negative feedback loop of the circadian clock. The coupling mechanism is incorporated through the global level of neurotransmitter concentration. Global coupling is efficient to synchronize a population of 10,000 cells. Synchronized cells can be entrained by a 24-h light-dark cycle. Simulations of the interaction between two populations representing two regions of the SCN show that the driven population can be phase-leading. Experimentally testable predictions are: 1), phases of individual cells are governed by their intrinsic periods; and 2), efficient synchronization is achieved when the average neurotransmitter concentration would dampen individual oscillators. However, due to the global neurotransmitter oscillation, cells are effectively synchronized.


Figures

FIGURE 1
FIGURE 1
Synchronization of 10,000 circadian oscillators (R = 0.63). (A) Distribution of the individual periods for K = 0. (B) Oscillations of Xi (in nM) for 10 randomly chosen oscillators. Different individual periods were obtained by rescaling rate constants (production and degradation), namely by dividing v1, v2, k3, v4, k5, v6, k7, and v8 by a scaling factor τi, i = 1,…,N. The values of τi are drawn randomly from a normal distribution of mean 1.0 and standard deviation 0.05. The periods are then distributed according a normal distribution with mean 23.5 h and standard deviation of 5%. (C) Distribution of the periods in the coupled system. (D) Oscillation of the mean field, F. Parameter values are: v1 = 0.7 nM/h; K1 = 1 nM; n = 4; v2 = 0.35 nM/h; K2 = 1 nM; k3 = 0.7/h; v4 = 0.35 nM/h; K4 = 1 nM; k5 = 0.7/h; v6 = 0.35 nM/h; K6 = 1 nM; k7 = 0.35/h; v8 = 1 nM/h; K8 = 1 nM; vc = 0.4 nM/h; Kc = 1 nM; K = 0.5; and L = 0. Concentrations are expressed in nM.
FIGURE 2
FIGURE 2
Coupling between two circadian oscillators. (A) Oscillations of variables X1 and X2, and of the mean field, F, and (B) limit cycle for the system of two coupled oscillators. Individual periods are 24.7 h and 23.5 h, respectively. Concentrations are expressed in nM. (C) Bifurcation diagram as a function of the coupling strength, K. In ordinates is plotted the variable X1 at the steady state (stable, XS or unstable, XU) or at the minimum (Xmin) and maximum (Xmax) of the oscillations. (D) Stability diagram as a function of the coupling strength K, and the ratio r of the periods of the two oscillators. Notation: FP, fixed point; HB, Hopf bifurcation; QP, quasiperiodicity; SA, small amplitude limit cycle; LP, limit point; PD, period doubling bifurcation; and P2, period-2 limit cycle. In C the ratio of the periods has been fixed to r = 0.9. These diagrams have been obtained with XPPAUT (http://www.math.pitt.edu/bard/xpp/xpp.html). Parameter values are the same as in Fig. 1.
FIGURE 3
FIGURE 3
Effect of a constant mean field on the dynamics of a single cell circadian oscillator. (A) Bifurcation diagram as a function of the mean field F taken as constant. HB denotes the Hopf bifurcation above which the limit cycle oscillations are abolished (located at F = 4.05 × 10⁻³). (B) Same as top-left panel with a logarithmic timescale. (C) Time-evolution to the steady state, for F = 0.05. The period of these damped oscillations is ∼27 h. (D) Variation of the period with F in the oscillatory domain (solid curve) and of the damped oscillations around the steady state (dashed curve). In A, B, and D, the two vertical dashed lines indicate the minimum (F = 0.036) and maximum (F = 0.06) values of the mean field F in the coupled state (see Fig. 1 D). These diagrams have been obtained with XPP-AUTO. Parameter values are the same as in Fig. 1.
FIGURE 4
FIGURE 4
Effect of the coupling strength K (A) on the order parameter R and (B) on the resulting period of the coupled system. This diagram has been obtained for a population of 1000 coupled circadian oscillators. Each dot corresponds to the mean over five runs, i.e., five time-series with different initial individual periods, but generated according the same probability distribution (see Fig. 1). Parameter values are the same as in Fig. 1.
FIGURE 5
FIGURE 5
Transient desynchronization of the oscillations. Shown are the oscillations of X for 10 oscillators randomly chosen among a total of 10,000 oscillators. During t = 50 h and t = 250 h (vertical lines), the oscillators are uncoupled (K = 0). During this period of time, each oscillator evolves toward its individual limit cycle characterized by its own period. After this period of time, the oscillators are rapidly resynchronized. Parameter values are the same as in Fig. 1.
FIGURE 6
FIGURE 6
Relation between the individual period and the phase in the coupled state (maximum of variable V with respect to the maximum of the mean field). A positive value indicates that the phase of the oscillator is advanced with respect to the mean field, whereas a negative value indicates that the phase of the oscillator is delayed. The curve indicated by DD corresponds to the case of constant conditions, illustrated in Fig. 1. The curve indicated by LD corresponds to the case of light-dark conditions, illustrated in Fig. 7.
FIGURE 7
FIGURE 7
Entrainment of the 10,000 coupled circadian cell system by a light-dark cycle (R = 0.53). The light-dark cycle is described by a square-wave forcing: L = 0 in dark phases and L = 0.01 in light phases. (A) Distribution of the individual periods. (B) Oscillations of X for 10 randomly chosen oscillators among a total of 10,000 oscillators. (C) Distribution of the periods in the coupled system. (D) Oscillation of the mean field, F. Parameter values are the same as in Fig. 1. Although the system displays a quasiperiodic behavior, the period and the phase of the oscillations are very well conserved. Only the amplitude undergoes very small variations. In B and D, the white and black bars indicate the light and dark phases, respectively.
FIGURE 8
FIGURE 8
Interaction between two cell populations. Each population counts 5000 cells. Cells from the first population (VL part of the SCN, solid line) are coupled through the mean field they are producing (K = 0.5), whereas cells from the second population (DM part, dashed line) are uncoupled but entrained by the mean field from the first population. Taken individually, cells of both populations undergo limit cycle oscillations, but with a slightly different mean period: the mean periods are 23.5 and 20 h for the VL and the DM population, respectively. (A) Constant conditions. (B) VL cells are entrained by a light-dark cycle, simulated by a square-wave forcing, as in Fig. 7. Parameter values are the same as in Fig. 7. In B, the white and black bars indicate the light and dark phases, respectively.

References

    1. Reppert, S. M., and D. R. Weaver. 2002. Coordination of circadian timing in mammals. Nature. 418:935–941. - PubMed
    1. Moore, R. Y., J. C. Speh, and R. K. Leak. 2002. Suprachiasmatic nucleus organization. Cell Tissue Res. 309:89–98. - PubMed
    1. Shirakawa, T., S. Honma, Y. Katsuno, H. Oguchi, and K. I. Honma. 2001. Multiple oscillators in the suprachiasmatic nucleus. Chronobiol. Int. 18:371–387. - PubMed
    1. Welsh, D. K., D. E. Logothetis, M. Meister, and S. M. Reppert. 1995. Individual neurons dissociated from rat suprachiasmatic nucleus express independently phased circadian firing rhythms. Neuron. 14:697–706. - PubMed
    1. Honma, S., W. Nakamura, T. Shirakawa, and K. Honma. 2004. Diversity in the circadian periods of single neurons of the rat suprachiasmatic nucleus depends on nuclear structure and intrinsic period. Neurosci. Lett. 358:173–176. - PubMed

Publication types