. 2005 Jun;17(6):1749-63.
doi: 10.1105/tpc.105.031732. Epub 2005 Apr 22.

COBRA, an Arabidopsis extracellular glycosyl-phosphatidyl inositol-anchored protein, specifically controls highly anisotropic expansion through its involvement in cellulose microfibril orientation

Affiliations

COBRA, an Arabidopsis extracellular glycosyl-phosphatidyl inositol-anchored protein, specifically controls highly anisotropic expansion through its involvement in cellulose microfibril orientation

François Roudier et al. Plant Cell. 2005 Jun.

Abstract

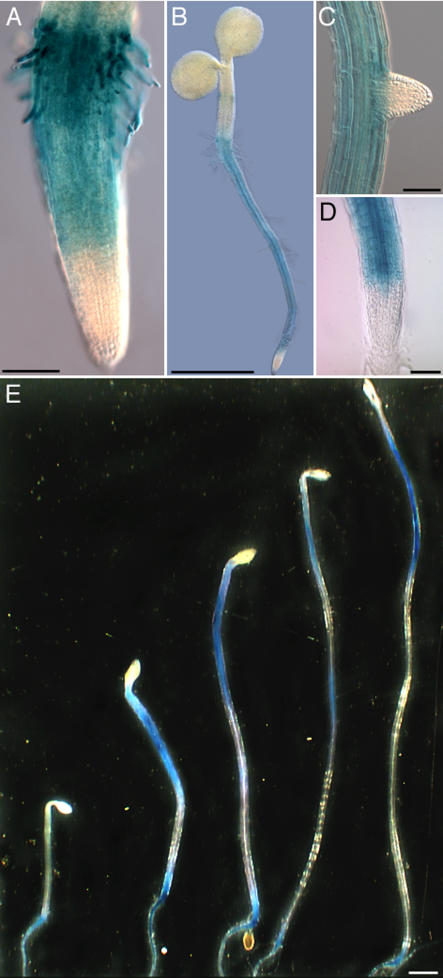
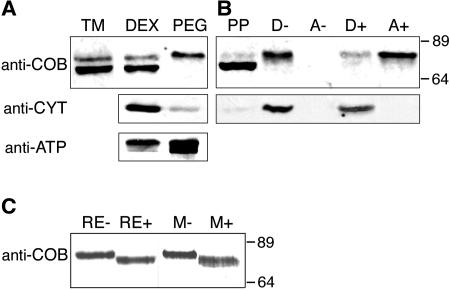
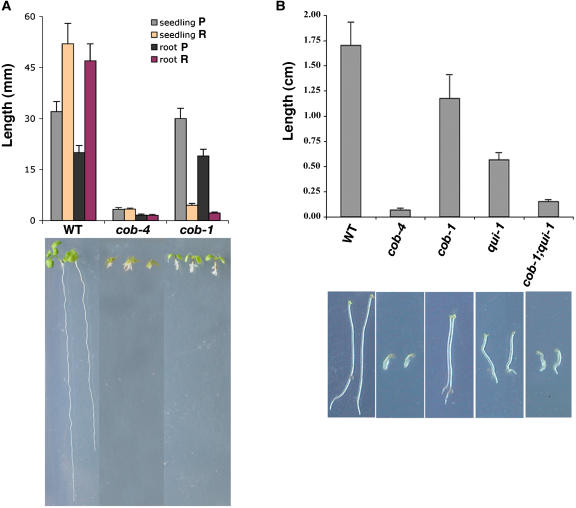
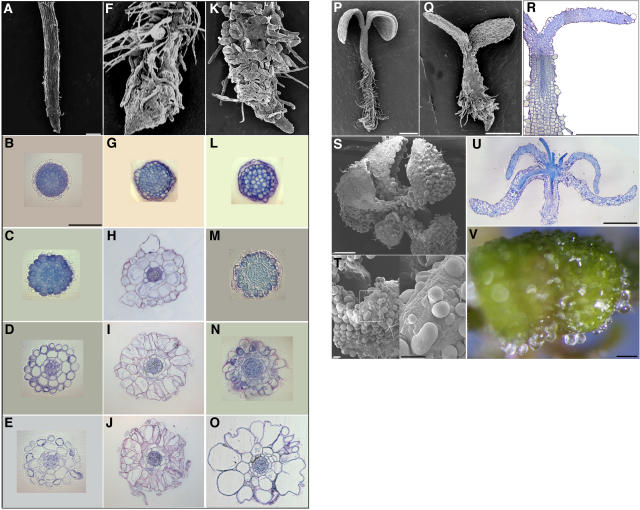
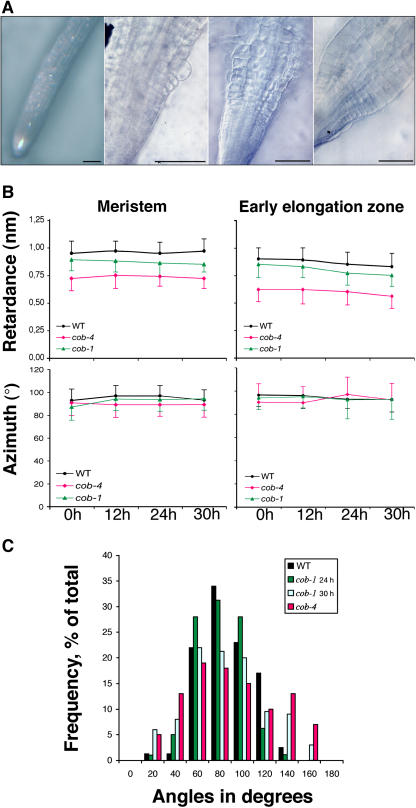
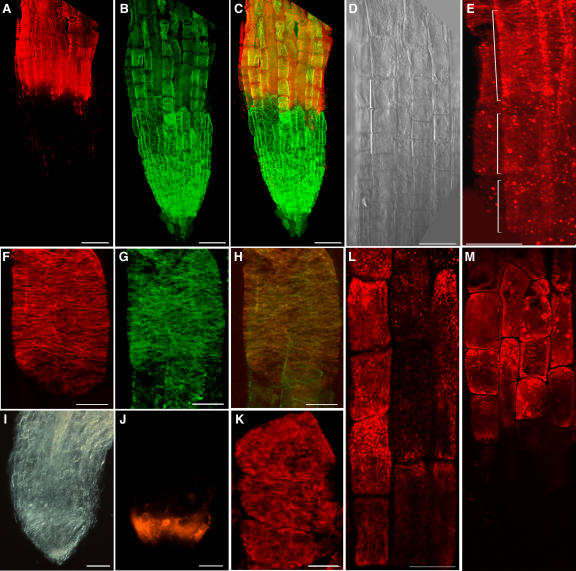
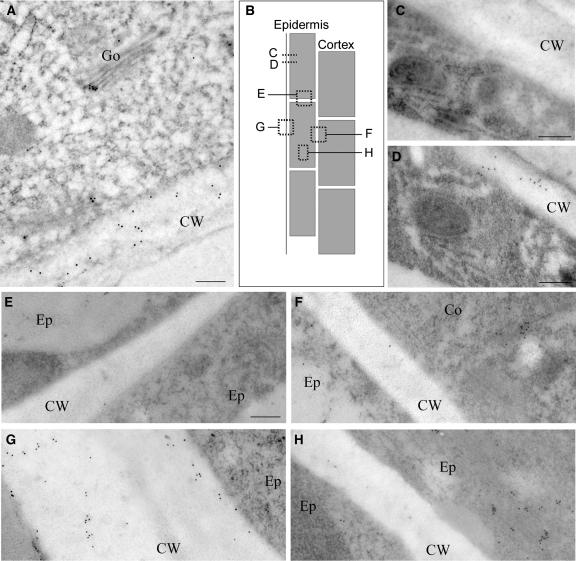
The orientation of cell expansion is a process at the heart of plant morphogenesis. Cellulose microfibrils are the primary anisotropic material in the cell wall and thus are likely to be the main determinant of the orientation of cell expansion. COBRA (COB) has been identified previously as a potential regulator of cellulose biogenesis. In this study, characterization of a null allele, cob-4, establishes the key role of COB in controlling anisotropic expansion in most developing organs. Quantitative polarized-light and field-emission scanning electron microscopy reveal that loss of anisotropic expansion in cob mutants is accompanied by disorganization of the orientation of cellulose microfibrils and subsequent reduction of crystalline cellulose. Analyses of the conditional cob-1 allele suggested that COB is primarily implicated in microfibril deposition during rapid elongation. Immunodetection analysis in elongating root cells revealed that, in agreement with its substitution by a glycosylphosphatidylinositol anchor, COB was polarly targeted to both the plasma membrane and the longitudinal cell walls and was distributed in a banding pattern perpendicular to the longitudinal axis via a microtubule-dependent mechanism. Our observations suggest that COB, through its involvement in cellulose microfibril orientation, is an essential factor in highly anisotropic expansion during plant morphogenesis.


Figures

Figure 1.
Figure 1.
Localization of GUS Activity under the Control of COB cis-Regulatory Regions. (A) to (D) GUS staining in 2-d-old root (A), 7-d-old seedling (B), and 12-d-old lateral and primary roots ([C] and [D]). (E) COB expression in etiolated hypocotyls at 3 to 7 d after germination. Bars = 100 μm in (A), (C), and (D), 1 mm in (B), and 2.5 mm in (E).
Figure 2.
Figure 2.
COB Is Plasma Membrane–Localized, GPI-Anchored, and N-Glycosylated. (A) Protein blot probed successively with anti-COB, anti-cytochrome b5, and anti-ATPase antibodies. Total membrane proteins (TM) were phase-partitioned into endomembranes (DEX) and plasma membrane–enriched protein fractions (PEG). (B) Protein blot probed successively with anti-COB and anti-cytochrome b5 antibodies. Proteins associated with total membranes were solubilized in Triton X-114 and phase-partitioned into an aqueous peripheral protein fraction (PP) and a detergent phase (D). The pure detergent phase was treated with PI-PLC (+) or with a buffer (−) and phase-partitioned into new detergent (D) and aqueous phases (A). (C) Protein blot probed with anti-COB antibodies. Root extracts (RE) or microsomal membranes (M) were incubated with peptide N-glycosidase F (+) or buffer (−), and proteins were separated by SDS-PAGE. Molecular weights are indicated at right.
Figure 3.
Figure 3.
Homozygous cob-4 Plants Have a Severe Growth Defect. (A) Length measurements of the conditional cob-1 and null cob-4 alleles under different growth conditions. Data for cob-1, cob-4, and wild-type plants grown under restrictive conditions are shown. P and R, permissive and restrictive conditions, respectively. Each bar represents the average ± sd of 15 seedlings. (B) Reduced hypocotyl elongation in cob and qui-1 mutants as well as in the cob-1 qui-1 double mutant. Hypocotyl lengths of 7-d-old dark-grown seedlings under permissive condition are shown. Each bar represents the average ± sd of 15 hypocotyls. Photographs of the relevant wild-type and mutant seedlings are shown below the bar graphs.
Figure 4.
Figure 4.
cob-4 Has Dramatic Morphological Alterations in Most Organs. Root phenotype analysis of wild-type ([A] to [E]), cob-4 ([F] to [J]), and cob-1 ([K] to [O]) plants. (A), (F), and (K) Scanning electron micrographs of 10-d-old roots. Bar = 100 μm. (B) to (E), (G) to (J), and (L) to (O) Light micrographs of 3-μm transverse sections in the region of the root cap-quiescent center ([B], [G], and [L]), meristem ([C], [H], and [M]), early elongation zone ([D], [I], and [N]), and late elongation zone [[E], [J], and [O]). Bar = 100 μm. (P) to (R) Scanning electron and light micrographs of 1-week-old cob-1 (P), cob-4 (Q), and corresponding longitudinal section (R). Bars = 500 μm. (S) to (V) Scanning electron ([S] and [U]) and light (V) micrographs of 18-d-old cob-4 aerial organs and corresponding longitudinal section (T). Bars = 500 μm in (S) and (U) and 100 μm in (T) and (V).
Figure 5.
Figure 5.
Crystalline Cellulose Organization and Root Morphology in the cob Alleles. (A) Time-course light micrographs of cob-1 root morphology at 0, 12, 14, and 30 h after the condition shift. Bars = 100 μm. (B) Quantification by polarized-light microscopy of the amount of cellulose (retardance) and its net orientation (azimuth) in the walls of meristematic and elongating cells. Data from 5-d-old wild-type, cob-1, and cob-4 seedlings at 0, 12, 24, and 30 h after transfer to high-growth-rate media are shown. Each data point represents the average ± sd of at least 15 cell walls. (C) Frequency distribution of cellulose microfibril-azimuth angles measured in the elongation zone of wild-type, cob-1, and cob-4 roots after the condition shift. F-test values (0.2 significance level) indicate that the modal distributions of azimuth angles are significantly different between the wild type and cob-4 (P = 0.081) and between cob-4 and cob-1 (24 h) (P = 0.056), whereas the wild type and cob-1 (24 h) are not significantly different (P = 0.87). At 30 h after the condition shift, the modal distributions of azimuth angles between the wild type and cob-1 (30 h) are significantly different (P = 0.129).
Figure 6.
Figure 6.
Organization of Cellulose Microfibrils Is Altered in the Elongation Zone of cob Mutants. FESEM images of the innermost layer of the cell wall of wild type ([A] to [D]), cob-4 ([E] to [H]), and cob-1 ([I] to [L′]) cryoplaned roots. The low-magnification (×250) images of the root indicate cells in the different root zones from which wall texture was analyzed at higher magnification (×100,000) FESEM imaging. In the meristem of the different genotypes ([B], [E], [J], and [J′]), microfibrils are approximately parallel and oriented transversely to the elongation axis. In the wild type, this typical microfibril organization pattern is maintained throughout the elongation zone ([C] and [D]). In cob-4, microfibrils in the elongation zone (G) and at the border with the maturation zone (H) are distributed randomly. Under conditions similar to a 24-h period after a shift to restrictive conditions, microfibrils in the cob-1 elongation zone ([K] and [K′]) and at the border with the maturation zone ([L] and [L′]) show a clear departure from the transverse orientation observed in the wild type. Microfibrils in cells of the cob-1 elongation zone often exhibit different net orientations in different zones of the same wall ([K] and [K′]). (J) and (J′), (K) and (K′), and (L) and (L′) represent images of two different areas in the same wall. Bars = 250 nm except in (A), (E), and (I), where they = 100 μm.
Figure 7.
Figure 7.
COB Immunolocalization in 5-d-Old Roots. Whole-mount confocal scanning micrographs of wild-type roots ([A] to [E]), wild-type elongating cells ([F] to [H] and [L]), and ton2 roots ([I] to [K]). Bars = 50 μm in (A) to (E) and (I), (J), (L) and (M) and 10 μm in (F) to (H) and (K). Brackets in (D) and (E) indicate the same three elongating cells. (A), (E), (F), and (J) to (L) Indirect fluorescence immunolocalization of COB using anti-COB antibodies. (B) and (G) Visualization of cortical microtubules by indirect immunofluorescence. (C) Combined images of COB (A) and microtubules (B) at the root tip. (D) and (I) Differential interference contrast micrographs of the wild-type elongation zone and the ton2-14 root tip, respectively. (H) Combined images of COB (F) and microtubules (G) in an elongating cell. (L) COB staining after treatment with 10 μM oryzalin for 45 min. Note patches, compared with the normal banding pattern. (M) COB staining after treatment with 50 μM brefeldin A for 45 min. Note intracellular accumulation of COB-containing clumps.
Figure 8.
Figure 8.
COB Subcellular Distribution in the Root Elongation Zone Revealed by 10-nm Immunogold Labeling of Sectioned High-Pressure-Frozen Material. (A) Tangential section from the outer epidermis shows COB associated with the Golgi and in the cell wall. (B) Scheme of the root in longitudinal view depicts the section planes from which the images in (C) to (H) were obtained. (C) and (D) Transverse sections from the same series of the outer epidermis ∼350 nm apart. Note the absence of COB from section (C) but its relative abundance in the cytoplasm and cell wall of (D), consistent with the banding pattern observed by immunofluorescence. (E) Transverse anticlinal section between adjacent epidermal cells shows low abundance of COB. (F) Longitudinal periclinal section between the epidermis and the cortex shows COB in the cytoplasm but relatively little in the cell wall. (G) Outer epidermal periclinal section shows abundant COB in both the cytoplasm and the cell wall. (H) Longitudinal-radial section between adjacent epidermal cell files shows COB in the cytoplasm but relatively little in the cell wall. Co, cortex; CW, cell wall; Ep, epidermis; Go, Golgi. Bars = 250 nm.

References

    1. Arioli, T., et al. (1998). Molecular analysis of cellulose biosynthesis in Arabidopsis. Science 279, 717–720. - PubMed
    1. Baskin, T.I. (2001). On the alignment of cellulose microfibrils by cortical microtubules: A review and a model. Protoplasma 215, 150–171. - PubMed
    1. Baskin, T.I., Beemster, G.T.S., Judy-March, J.E., and Marga, F. (2004). Disorganization of cortical microtubules stimulates tangential expansion and reduces the uniformity of cellulose microfibril alignment among cells in the root of Arabidopsis. Plant Physiol. 135, 2279–2290. - PMC - PubMed
    1. Baskin, T.I., Wilson, J.E., Cork, A., and Williamson, R.E. (1994). Morphology and microtubule organization in Arabidopsis roots exposed to oryzalin or taxol. Plant Cell Physiol. 35, 935–942. - PubMed
    1. Benfey, P.N., Linstead, P.J., Roberts, K., Schiefelbein, J.W., Hauser, M.T., and Aeschbacher, R.A. (1993). Root development in Arabidopsis: Four mutants with dramatically altered root morphogenesis. Development 119, 57–70. - PubMed

Publication types

MeSH terms