. 2005 May;138(1):383-92.
doi: 10.1104/pp.104.058800. Epub 2005 Apr 22.

Nematode infection triggers the de novo formation of unloading phloem that allows macromolecular trafficking of green fluorescent protein into syncytia

Affiliations

Nematode infection triggers the de novo formation of unloading phloem that allows macromolecular trafficking of green fluorescent protein into syncytia

Stefan Hoth et al. Plant Physiol. 2005 May.

Abstract

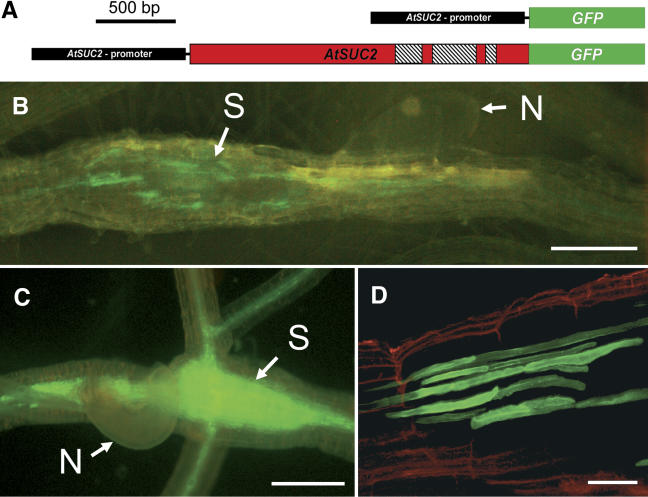
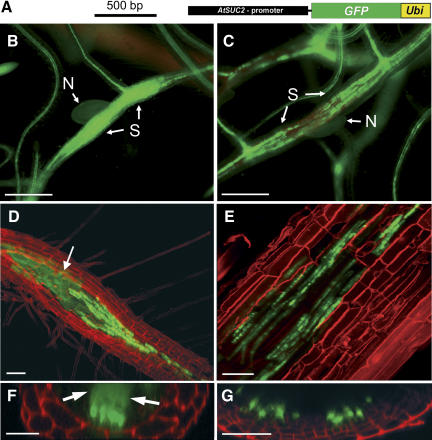
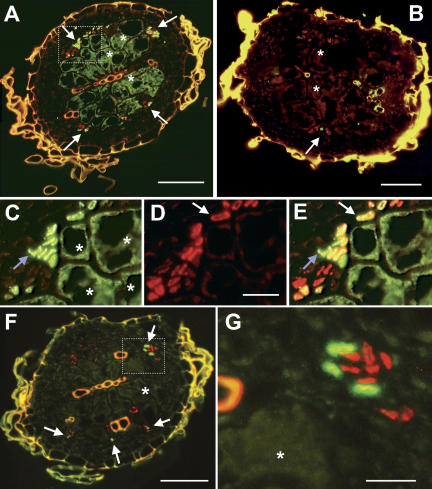
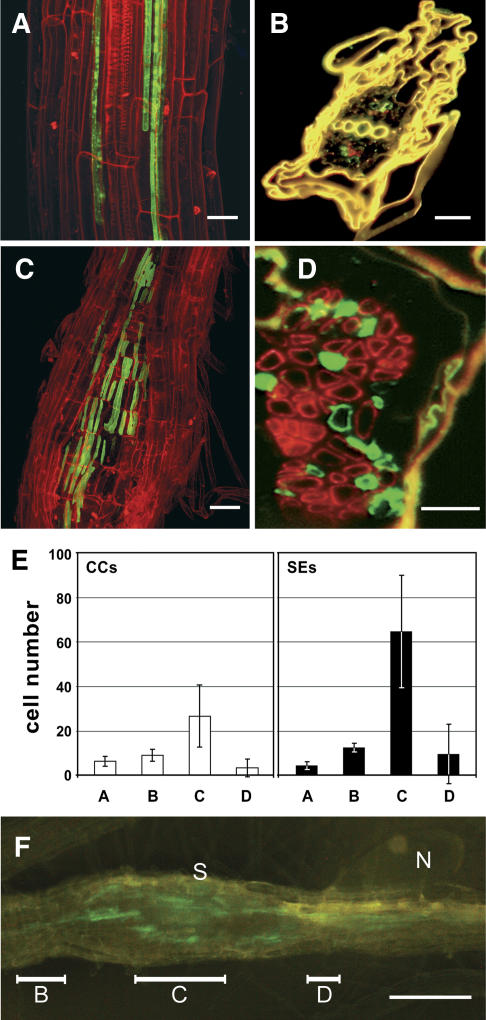
Syncytial feeding complexes induced by the cyst nematode Heterodera schachtii represent strong metabolic sinks for photoassimilates. These newly formed structures were described to be symplastically isolated from the surrounding root tissue and their mechanism of carbohydrate import has repeatedly been under investigation. Here, we present analyses of the symplastic connectivity between the root phloem and these syncytia in nematode-infected Arabidopsis (Arabidopsis thaliana) plants expressing the gene of the green fluorescent protein (GFP) or of different GFP fusions under the control of the companion cell (CC)-specific AtSUC2 promoter. In the same plants, phloem differentiation during syncytium formation was monitored using cell-specific antibodies for CCs or sieve elements (SEs). Our results demonstrate that free, CC-derived GFP moved freely from the phloem into the syncytial domain. No or only marginal cell-to-cell passage of GFP was observed into other root cells adjacent to these syncytia. In contrast, membrane-anchored GFP variants as well as soluble GFP fusions with increased molecular masses were restricted to the SE-CC complex. The presented data also show that nematode infection triggers the de novo formation of phloem containing an approximately 3-fold excess of SEs over CCs. This newly formed phloem exhibits typical properties of unloading phloem previously described in other sink tissues. Our results reveal the existence of a symplastic pathway between phloem CCs and nematode-induced syncytia. The plasmodesmata responsible for this symplastic connectivity allow the cell-to-cell movement of macromolecules up to 30 kD and are likely to represent the major or exclusive path for the supply of assimilates from the phloem into the syncytial complex.


Figures

Figure 1.
Figure 1.
Fluorescence of GFP and tmGFP2 in nematode-infected roots of transgenic Arabidopsis plants. A, Schematic representation of the AtSUC2 promoter∷GFP (mobile) and the AtSUC2 promoter∷tmGFP2 (membrane-targeted) fusions present in the transgenic lines analyzed (Stadler et al., 2005). The AtSUC2 promoter is shown in black, the ORF of GFP frame is green, and the genomic-coding sequence of AtSUC2 is red. The 3 introns in the genomic AtSUC2 sequence are hatched. B, tmGFP2 fluorescence in AtSUC2 promoter∷tmGFP2 plants 13 d after infection (dai). tmGFP2 fluorescence is seen in distinct structures in the syncytial zone (N, Nematode; S, syncytium). C, Fluorescence of free GFP in AtSUC2 promoter∷GFP plants 11 dai. The GFP signal was observed in the root vasculature and in the syncytium. D, Optical section of the tmGFP2 signal in the syncytial area of an infected AtSUC2-promoter∷tmGFP2 root (14 dai). tmGFP2 fluorescence is seen only in elongated cells around the syncytium. Red fluorescence represents endogenous fluorescence of the cell walls. Scale bars represent 200 μm in B and C, and 40 μm in D.
Figure 2.
Figure 2.
GFP trafficking from the SE-CC complex into the syncytium. A, Schematic representation of the AtSUC2 promoter∷GFP-UBI construct (Stadler et al., 2005) used in the plants analyzed in C, E, and G. The AtSUC2 promoter is shown in black, the GFP ORF is green, and the coding sequence for UBI (Ubi) is shown in yellow. Plants analyzed in B, D, and F were transformed with the AtSUC2 promoter∷GFP construct shown in Figure 1. B, Epifluorescence microscopic detection of GFP fluorescence in the phloem and in the syncytium of an AtSUC2 promoter∷GFP root 14 d after infection (dai; N, nematode; S, syncytium). The GFP signal is evenly distributed within the syncytium. C, Epifluorescence microscopic detection of GFP-UBI fluorescence in the phloem and in a syncytium of an AtSUC2 promoter∷GFP-UBI root 14 dai. The GFP-UBI signal is detected only in distinct cells. Note: Approximately the same fluorescence intensity is seen in the vascular tissue of the AtSUC2 promoter∷GFP plant shown in A and of the AtSUC2 promoter∷GFP-UBI plants shown in B. D and E, Confocal images of fluorescent cells and of fluorescent syncytia in the root of an AtSUC2 promoter∷GFP plant (D) or of an AtSUC2 promoter∷GFP-UBI plant (E) both recorded 14 dai. The white arrow in D marks the diffuse fluorescence of free GFP in the syncytium that is absent in E. F and G, Optical z-sections of fluorescent cells and of fluorescent syncytia in the root of an AtSUC2 promoter∷GFP plant (F) or of an AtSUC2 promoter∷GFP-UBI plant (G). Both z-sections show distinctly labeled cells at the surface of the syncytia. Diffusion of GFP into the syncytium is only seen in F (white arrows). Roots shown in D to G were treated with propidium iodide to visualize the cell walls. Scale bars represent 500 μm in B and C, 80 μm in D, 40 μm in E, 25 μm in F, and 20 μm in G.
Figure 3.
Figure 3.
Immunolocalization of GFP and tmGFP9 in cross sections from syncytia. A, Immunohistochemical staining of the cross section through the syncytium of an AtSUC2 promoter∷GFP plant decorated with anti-GFP antiserum (green fluorescence resulting from FITC-conjugated second antibody) and with the SE-specific monoclonal RS6 antiserum (red fluorescence results from TRITC-conjugated second antibody). Free GFP was detected in CCs and in some SEs (white arrows) as well as in the syncytium (asterisks). B, Identical staining as in A but in an AtSUC2 promoter∷tmGFP9 plant. The tmGFP9 protein was detected only in CCs (white arrows). No fluorescence was seen in the syncytium (asterisks). C, Higher magnification of the boxed area from A showing only the green fluorescence resulting from the immunolocalization of GFP. The blue arrow marks a cluster of cells from the vascular bundle. Large syncytial cells are marked with asterisks. D, Same section as in C showing only the red fluorescence resulting from the SE-specific RS6 antiserum. The white arrow marks a single SE. A faint red background reaction in all other cells is typical for this antibody. E, Merging images C and D identifies CCs (only green GFP fluorescence; blue arrow), SEs that do not contain GFP (only red RS6-derived fluorescence) and SEs that do contain GFP (the yellow staining results from GFP immunolocalization plus RS6-derived fluorescence; white arrow). F, Immunohistochemical staining of a cross section through the syncytium of an AtSUC2 promoter∷GFP plant (same syncytium as in A) decorated with anti-AtSUC2 antiserum (green fluorescence from FITC-conjugated second antibody) and with the SE-specific monoclonal RS6 antiserum (red fluorescence as in A). The AtSUC2 protein was detected only in CCs (white arrows) and not in the SEs or in the syncytium (asterisk). G, Higher magnification of the boxed area from F showing a section of a yellow xylem vessel on the left side, three CCs (green) labeled with anti-AtSUC2 antiserum, and eight SEs (red) labeled with the monoclonal RS6 antiserum. No green fluorescence is seen in the syncytial part shown in this section (asterisk). Yellow fluorescence in A, B and F results from the autofluorescence of cell wall phenolics. Scale bars are 50 μm in A, B and F, and 10 μm in C, D, E and G.
Figure 4.
Figure 4.
The formation of syncytia triggers an increase in the numbers of SEs and CCs. A, Confocal image of tmGFP2 fluorescence (green) and in the 2 vascular strands typically seen in uninfected roots of AtSUC2-promoter∷tmGFP2 plants. B, Immunohistochemical staining of GFP and of SEs in an uninfected AtSUC2-promoter∷tmGFP2 root. The cross section was double labeled with anti-GFP antiserum (yielding green fluorescence in CCs) and with the SE-specific monoclonal RS6 antiserum (yielding red fluorescence). As shown in A, only very few cells of each type are present in the vasculature of uninfected Arabidopsis roots. The yellow color results from the autofluorescence of cell wall phenolics. C, Confocal image of tmGFP2 fluorescence in the phloem next to the syncytium of an AtSUC2-promoter∷tmGFP2 plant. D, Immunohistochemical staining of a cross section through the syncytium of a nematode-infected AtSUC2-promoter∷tmGFP2 root. The figure shows a section with numerous phloem cells that had been double labeled the using the same antibodies as in B. E, Numbers of CCs (white bars) and SEs (black bars) counted in cross sections from uninfected roots (A) or in cross sections from different syncytial regions: start of the syncytium (B), center of the syncytium (C), and region next to the nematode feeding site (D). F, Same syncytium as in Figure 1B with bars indicating the three regions used to determine CC and SE numbers in E (N, Nematode; S, syncytium). Roots shown in the confocal images A and C were treated with propidium iodide to visualize the cell walls. Scale bars represent 40 μm in A, 20 μm in B and C,10 μm in D and 200 μm in F.

Similar articles

Cited by

References

    1. Ayre BG, Keller F, Turgeon R (2003) Symplastic continuity between companion cells and the translocation stream: Long-distance transport is controlled by retention and retrieval mechanisms in the phloem. Plant Physiol 131: 1518–1528 - PMC - PubMed
    1. Barthels N, van der Lee FM, Klap J, Goddijn OJ, Karimi M, Puzio P, Grundler FM, Ohl SA, Lindsey K, Robertson L, et al (1997) Regulatory sequences of Arabidopsis drive reporter gene expression in nematode feeding structures. Plant Cell 9: 2119–2134 - PMC - PubMed
    1. Böckenhoff A, Grundler FMW (1994) Studies on the nutrient uptake by the beet cyst nematode H. schachtii by in situ microinjection of fluorescent probes into the feeding structures in Arabidopsis thaliana. Parasitology 109: 249–254
    1. Böckenhoff A, Prior DA, Grundler FM, Oparka KJ (1996) Induction of phloem unloading in Arabidopsis thaliana roots by the parasitic nematode Heterodera schachtii. Plant Physiol 112: 1421–1427 - PMC - PubMed
    1. Crawford KM, Zambryski PC (2001) Non-targeted and targeted protein movement through plasmodesmata in leaves in different developmental and physiological states. Plant Physiol 125: 1802–1812 - PMC - PubMed

Publication types

MeSH terms

Substances