. 2005 May;138(1):142-52.
doi: 10.1104/pp.104.055483. Epub 2005 Apr 22.

Spatial and temporal distribution of polyamine levels and polyamine anabolism in different organs/tissues of the tobacco plant. Correlations with age, cell division/expansion, and differentiation

Affiliations

Spatial and temporal distribution of polyamine levels and polyamine anabolism in different organs/tissues of the tobacco plant. Correlations with age, cell division/expansion, and differentiation

Konstantinos A Paschalidis et al. Plant Physiol. 2005 May.

Abstract

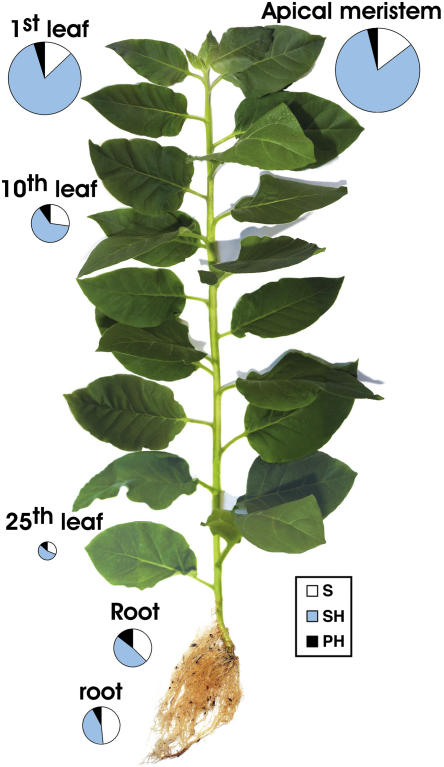
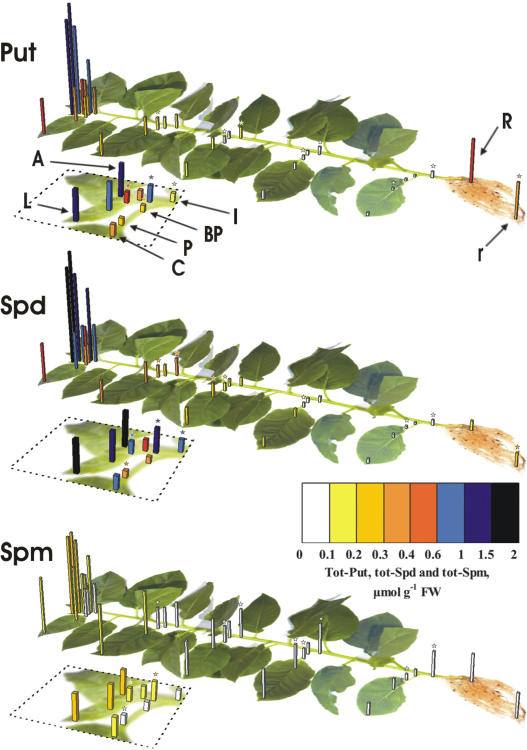
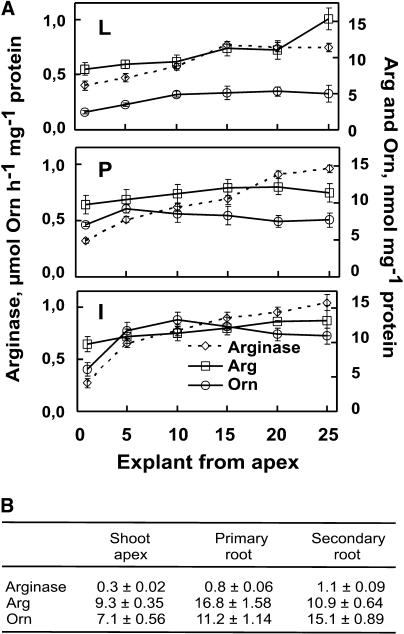
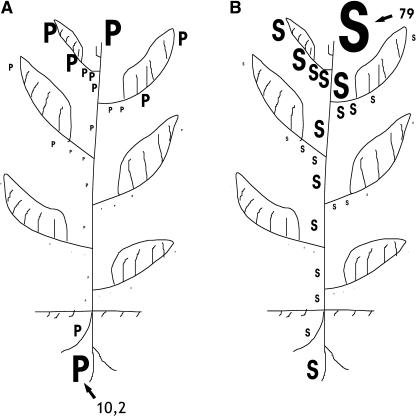
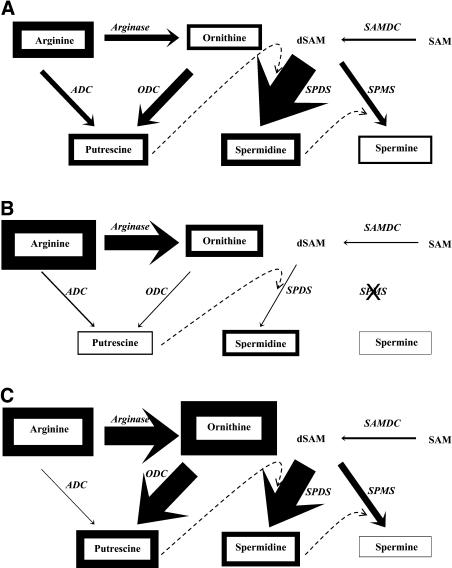
Polyamine (PA) titers and biosynthesis follow a basipetal decrease along the tobacco (Nicotiana tabacum) plant axis, and they also correlate negatively with cell size. On the contrary, the titers of arginine (Arg), ornithine (Orn), and arginase activity increase with age. The free (soluble)/total-PA ratios gradually increase basipetally, but the soluble conjugated decrease, with spermidine (Spd) mainly to determine these changes. The shoot apical meristems are the main site of Spd and spermine biosynthesis, and the hypogeous tissues synthesize mostly putrescine (Put). High and low Spd syntheses are correlated with cell division and expansion, respectively. Put biosynthetic pathways are differently regulated in hyper- and hypogeous tobacco tissues: Only Arg decarboxylase is responsible for Put synthesis in old hypergeous vascular tissues, whereas, in hypogeous tissues, arginase-catalyzed Orn produces Put via Orn decarboxylase. Furthermore, Orn decarboxylase expression coincides with early cell divisions in marginal sectors of the lamina, and Spd synthase strongly correlates with later cell divisions in the vascular regions. This detailed spatial and temporal profile of the free, soluble-conjugated, and insoluble-conjugated fractions of Put, Spd, and spermine in nearly all tobacco plant organs and the profile of enzymes of PA biosynthesis at the transcript, protein, and specific activity levels, along with the endogenous concentrations of the precursor amino acids Arg and Orn, offer new insight for further understanding the physiological role(s) of PAs. The results are discussed in the light of age dependence, cell division/expansion, differentiation, phytohormone gradients, senescence, and sink-source relationships.


Figures

Figure 1.
Figure 1.
Total PA titers in tobacco plants. The size of the circles designates the PA values in different organs of the plant. The white portions of circles correspond to the amount of S-PAs, the blue portions to the SH-PAs, and the black portions to the PH-PAs. The size of the circle in the apical meristem corresponds to 3,180 nmol g−1 FW and includes the white, blue, and black portions corresponding, in turn, to 466, 2,590, and 124 nmol g−1 FW, respectively. The sizes of circles (and the respective portions) in the other plant organs are proportionally depicted.
Figure 2.
Figure 2.
Total Put, total Spd, and total Spm content in different parts of tobacco plants. Dotted lines contain scale-ups of the figures, containing the shoot apex (A), the first leaf, and part of the fifth leaf. L, Apical and marginal leaf lamina; C, central lamina; P, acropetal petiole; BP, basipetal petiole; I, internode; R, primary root; r, secondary root. Data for L, C, P, BP, and I are depicted in the first, fifth, 10th, 15th, 20th, and 25th developmental stages (numbered from apex). Asterisk-marked data regions indicate statistically significant differences (P = 0.01) when compared with the adjacent acropetal ones of the same developmental stage. In the first two developmental stages, asterisks are depicted in the scale-up parts, whereas asterisks on secondary roots indicate statistically significant differences from the primary roots.
Figure 3.
Figure 3.
Expression patterns of ADC, ODC, SAMDC, SPDS, and SPMS in the soluble fractions from tobacco plant tissues. A, Shoot apex; L, apical and marginal leaf lamina (⋄); P, acropetal petiole (▵); I, internode (dotted line); R, primary root; r, secondary root. A, Specific activities in L, P, and I at different developmental stages. B, Specific activities of ADC, ODC, and SAMDC (nmol CO2 h−1 mg−1 protein), SPDS (nmol Spd h−1 mg−1 protein), and SPMS (nmol Spm h−1 mg−1 protein) in shoot apex, primary, and secondary roots. C, RNA gel-blot analysis of the expression of adc, odc, samdc, and spds genes. D, Quantification of mRNA levels (mRNAs/actin mRNAs). E, Western-blot analysis of ADC protein. Numbering started from the apical organ being designated as first. Error bars represent ±se.
Figure 4.
Figure 4.
Arginase-specific activities, and Arg and Orn levels in tobacco plants. A, Specific activities in L, P, and I. L, Apical and marginal leaf lamina; P, acropetal petiole; I, internode; arginase, ⋄ with dotted line; Arg, □; Orn, ○. B, Arginase activities (μmol Orn h−1 mg−1 protein) and endogenous levels of Arg and Orn (nmol mg−1 protein) in shoot apex, primary root, and secondary root. Error bars represent ±se.
Figure 5.
Figure 5.
PAs as signal-integrating developmental processes throughout the tobacco plant. PA synthesis is estimated from the enzyme-specific activities in the soluble fractions. Activity levels are represented by magnitude levels depicted by the sizes of letters P for Put synthesis and S for synthesis of higher PAs (Spd and Spm). A, Sites of Put synthesis. Synthesis of Put is depicted as a sum of ADC and ODC activities. B, Sites of synthesis of higher PAs. Synthesis of higher PAs is depicted as a sum of SPDS and SPMS activities. Numbers 10.2 and 79 show (with arrows) the activity levels (in nmol [of the product measured] h−1 mg−1 protein) depicted by the sizes of the biggest P and S, respectively. All the other sizes of P and S are depicted proportionally to the respective biggest ones.
Figure 6.
Figure 6.
The tobacco PA biosynthetic pathway in the youngest leaf (A), oldest leaf (B), and young roots (C). The endogenous contents of amino acids and free PAs are depicted by the thickness of their boxes, whereas the soluble-specific activities of the biosynthetic enzymes (in italics) are depicted by the thickness of the corresponding arrows. In the youngest leaf (A), the contents of Arg, Orn, Put, Spd, and Spm (nmol mg−1 protein), depicted by the corresponding thicknesses of boxes, are 8.6, 3.4, 6.8, 7.8, and 2.5 respectively, whereas the specific activities of ADC, ODC, SAMDC, SPDS, SPMS, and Arginase (nmol product h−1 mg−1 protein), depicted by the corresponding thicknesses of arrows, are 2.4, 4.3, 0.9, 28.1, 5.2, and 373, respectively. (For depicting reasons, thicknesses of ADC, ODC, and SAMDC are estimated 2-fold higher than thicknesses of SPDS and SPMS, whereas thicknesses of Arg are estimated 60-fold lower.) The thicknesses of boxes and arrows in B and C are depicted proportionally to the respective thicknesses in A.

References

    1. Alabadí D, Agüero MS, Pérez-Amador MA, Carbonell J (1996) Arginase, arginine decarboxylase, ornithine decarboxylase, and polyamines in tomato ovaries: changes in unpollinated ovaries and parthenocarpic fruits induced by auxin or gibberellin. Plant Physiol 112: 1237–1244 - PMC - PubMed
    1. Alabadí D, Carbonell J (1998) Expression of ornithine decarboxylase is transiently increased by pollination, 2,4-dichlorophenoxyacetic acid, and gibberellic acid in tomato ovaries. Plant Physiol 118: 323–328 - PMC - PubMed
    1. Alabadí D, Carbonell J (1999) Molecular cloning and characterization of a tomato (Lycopersicon esculentum Mill.) spermidine synthase cDNA (accession no. AJ006414). (PGR 99–103). Plant Physiol 120: 935
    1. Aziz A (2003) Spermidine and related-metabolic inhibitors modulate sugar and amino acid levels in Vitis vinifera L.: possible relationships with initial fruitlet abscission. J Exp Bot 54: 355–363 - PubMed
    1. Bassie L, Noury M, Lepri O, Lahaye T, Christou P, Capell T (2000) Promoter strength influences polyamine metabolism and morphogenic capacity in transgenic rice tissues expressing the oat adc cDNA constitutively. Transgenic Res 9: 33–42 - PubMed

Publication types

LinkOut - more resources