. 2005 Apr 22;33(7):2290-301.
doi: 10.1093/nar/gki519. Print 2005.

Computational technique for improvement of the position-weight matrices for the DNA/protein binding sites

Affiliations

Computational technique for improvement of the position-weight matrices for the DNA/protein binding sites

Naum I Gershenzon et al. Nucleic Acids Res. .

Abstract

Position-weight matrices (PWMs) are broadly used to locate transcription factor binding sites in DNA sequences. The majority of existing PWMs provide a low level of both sensitivity and specificity. We present a new computational algorithm, a modification of the Staden-Bucher approach, that improves the PWM. We applied the proposed technique on the PWM of the GC-box, binding site for Sp1. The comparison of old and new PWMs shows that the latter increase both sensitivity and specificity. The statistical parameters of GC-box distribution in promoter regions and in the human genome, as well as in each chromosome, are presented. The majority of commonly used PWMs are the 4-row mononucleotide matrices, although 16-row dinucleotide matrices are known to be more informative. The algorithm efficiently determines the 16-row matrices and preliminary results show that such matrices provide better results than 4-row matrices.


Figures
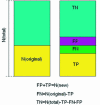
Figure 1
Figure 1
The schematic presentation of TP, FP, TN and FN. The number Norig in the left rectangle represents the amount of sites recognized by the original matrix as respective TFBS among all considered sites Ntotal ×lw in the given window lw in all promoter sequences Ns from the training dataset. The number TP is the amount of sites recognized by the new matrix among Norig so the rest of Norig is FN. The number of sites recognized by the new matrix but not included in Norig is FP. Finally, the number TN is the total number of considered sites Ntotal minus TP, FP and FN.
Figure 2
Figure 2
The flowchart of optimization process.
Figure 3
Figure 3
The occurrence frequency (the percentage of sequences having a considered motif centered at particular position) distribution of the GC-box sites found by the original matrix. The distribution is based on scanning of DBTSS (magenta, positive strand; red, negative strand; dark blue, both strands) and EPD (green, both stands) sequences. The value at each position is an 11 point sliding average. The TSS is placed at position +1. The straight horizontal line depicts the average amount of GC-box sites found in both strands of the randomly generated sequence with the same percentage of each of 4 nt as in the training set of promoter sequences, namely 20.6% for A and T, and 29.4% for C and G. The shadow rectangles indicate SD calculated based on 1871 random sequences (short rectangle) and on 8973 random sequences (long rectangle), respectively.
Figure 4
Figure 4
The sensitivity/specificity ratios for the original and new matrices. The averaged occurrence frequency of GC-box sites found by the original matrix (circle at the left upper corner) and two sets of new 4-row (squares) and 16-row (diamonds) matrices in the randomly generated sequence with the same percentage of each of four nucleotides as in the training set of promoter sequences versus sensitivity. The x-axis is the percentage of recognized sites from a control set of experimentally defined sites.
Figure 5
Figure 5
The occurrence frequency distribution of the GC-box sites found by the 16-row PWM with maximal sensitivity. The occurrence frequency distribution of the GC-box sites based on scanning of DBTSS (magenta, positive strand; red, negative strand; dark blue, both strands) and EPD (green, both stands) sequences. The rest is as in Figure 3.
Figure 6
Figure 6
The occurrence frequency of GC-box sites versus occurrence frequency of known genes in chromosomes of human genome. The OF of sites were obtained by 16-row matrix with maximal sensitivity. The diamonds and squares show the averaged OF of each chromosome in whole and conserved sequences, respectively.

References

    1. Berg O., von Hippel P. Selection of DNA binding sites by regulatory proteins. Statistical-mechanical theory and application to operators and promoters. J. Mol. Biol. 1987;193:723–750. - PubMed
    1. Day W.H., McMorris F.R. Threshold consensus methods for molecular sequences. J. Theor. Biol. 1992;159:481–489. - PubMed
    1. Stormo G. DNA binding sites: representation and discovery. Bioinformatics. 2000;16:16–23. - PubMed
    1. Stormo G., Schneider T., Gold L., Ehrenfeucht A. Use of the ‘Perceptron’ algorithm to distinguish translational initiation sites in E. coli. Nucleic Acids Res. 1982;10:2997–3011. - PMC - PubMed
    1. Harr R., Haggstrom M., Gustafsson P. Search algorithm for pattern match analysis of nucleic acid sequences. Nucleic Acids Res. 1983;11:2943–2957. - PMC - PubMed

Publication types