

The beta subunit of the Na+/K+-ATPase follows the conformational state of the holoenzyme
- PMID: 15851504
- PMCID: PMC2217500
- DOI: 10.1085/jgp.200409186
The beta subunit of the Na+/K+-ATPase follows the conformational state of the holoenzyme
Abstract
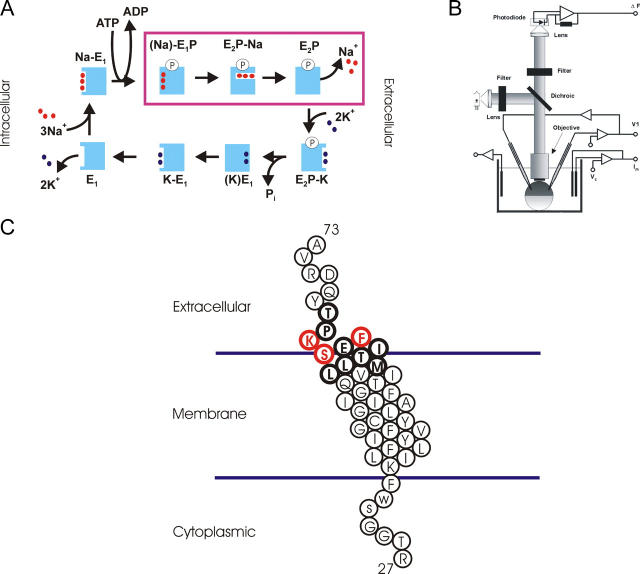
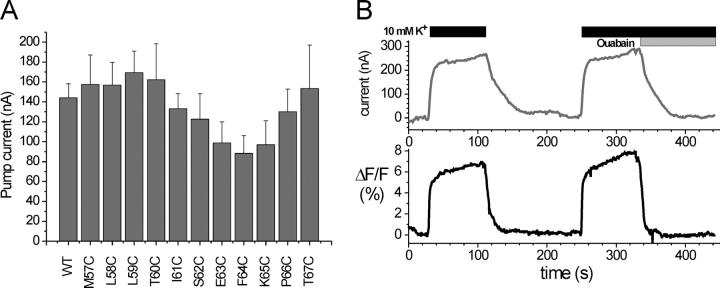
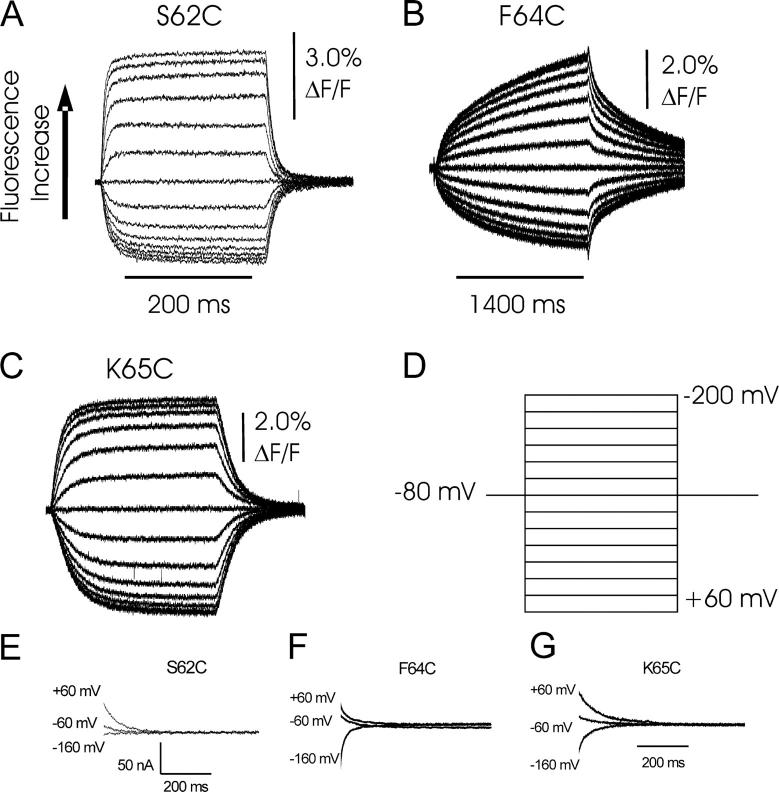
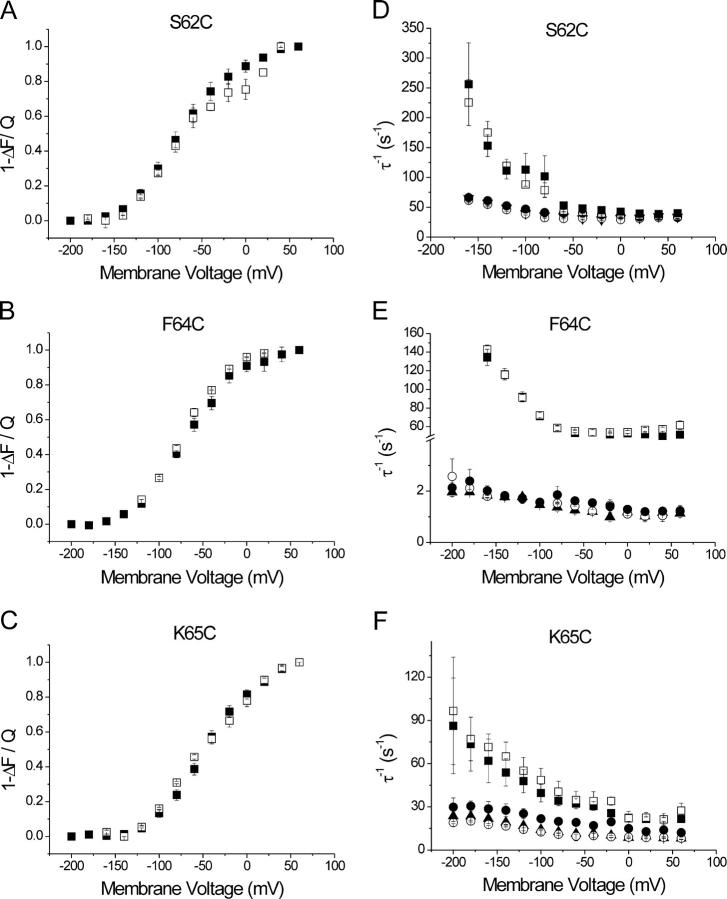
The Na+/K+-ATPase is a ubiquitous plasma membrane ion pump that utilizes ATP hydrolysis to regulate the intracellular concentration of Na+ and K+. It is comprised of at least two subunits, a large catalytic alpha subunit that mediates ATP hydrolysis and ion transport, and an ancillary beta subunit that is required for proper trafficking of the holoenzyme. Although processes mediated by the alpha subunit have been extensively studied, little is known about the participation of the beta subunit in conformational changes of the enzyme. To elucidate the role of the beta subunit during ion transport, extracellular amino acids proximal to the transmembrane region of the sheep beta1 subunit were individually replaced for cysteines. This enabled sulfhydryl-specific labeling with the environmentally sensitive fluorescent dye tetramethylrhodamine-6-maleimide (TMRM) upon expression in Xenopus oocytes. Investigation by voltage-clamp fluorometry identified three reporter positions on the beta1 subunit that responded with fluorescence changes to alterations in ionic conditions and/or membrane potential. These experiments for the first time show real-time detection of conformational rearrangements of the Na+/K+-ATPase through a fluorophore-labeled beta subunit. Simultaneous recording of presteady-state or stationary currents together with fluorescence signals enabled correlation of the observed environmental changes of the beta subunit to certain reaction steps of the Na+/K+-ATPase, which involve changes in the occupancy of the two principle conformational states, E1P and E2P. From these experiments, evidence is provided that the beta1-S62C mutant can be directly used to monitor the conformational state of the enzyme, while the F64C mutant reveals a relaxation process that is triggered by sodium transport but evolves on a much slower time scale. Finally, shifts in voltage dependence and kinetics observed for mutant K65C show that this charged lysine residue, which is conserved in beta1 isoforms, directly influences the effective potential that determines voltage dependence of extracellular cation binding and release.
Figures


Similar articles
-
Characterization of Na,K-ATPase and H,K-ATPase enzymes with glycosylation-deficient beta-subunit variants by voltage-clamp fluorometry in Xenopus oocytes.Biochemistry. 2008 Apr 8;47(14):4288-97. doi: 10.1021/bi800092k. Epub 2008 Mar 15. Biochemistry. 2008. PMID: 18341291
-
Conformational dynamics of the Na+/K+-ATPase probed by voltage clamp fluorometry.Proc Natl Acad Sci U S A. 2003 Feb 4;100(3):964-9. doi: 10.1073/pnas.0337336100. Epub 2003 Jan 27. Proc Natl Acad Sci U S A. 2003. PMID: 12552111 Free PMC article.
-
Structural arrangement and conformational dynamics of the gamma subunit of the Na+/K+-ATPase.Biochemistry. 2008 Jan 8;47(1):257-66. doi: 10.1021/bi701799b. Epub 2007 Dec 15. Biochemistry. 2008. PMID: 18081317
-
Voltage clamp fluorometry: combining fluorescence and electrophysiological methods to examine the structure-function of the Na(+)/K(+)-ATPase.Biochim Biophys Acta. 2009 Jun;1787(6):714-20. doi: 10.1016/j.bbabio.2009.03.021. Epub 2009 Apr 8. Biochim Biophys Acta. 2009. PMID: 19361481 Review.
-
[Na, K-ATPase--its structure, function and intracellular transport].Nihon Rinsho. 1996 Mar;54(3):586-94. Nihon Rinsho. 1996. PMID: 8904209 Review. Japanese.
Cited by
-
beta-Subunit overexpression alters the stoicheometry of assembled Na-K-ATPase subunits in MDCK cells.Am J Physiol Renal Physiol. 2008 Nov;295(5):F1314-23. doi: 10.1152/ajprenal.90406.2008. Epub 2008 Aug 13. Am J Physiol Renal Physiol. 2008. PMID: 18701620 Free PMC article.
-
Examining the conformational dynamics of membrane proteins in situ with site-directed fluorescence labeling.J Vis Exp. 2011 May 29;(51):2627. doi: 10.3791/2627. J Vis Exp. 2011. PMID: 21673634 Free PMC article.
-
Displacement of the Na+/K+ pump's transmembrane domains demonstrates conserved conformational changes in P-type 2 ATPases.Proc Natl Acad Sci U S A. 2021 Feb 23;118(8):e2019317118. doi: 10.1073/pnas.2019317118. Proc Natl Acad Sci U S A. 2021. PMID: 33597302 Free PMC article.
-
Transient Electrical Currents Mediated by the Na+/K+-ATPase: A Tour from Basic Biophysics to Human Diseases.Biophys J. 2020 Jul 21;119(2):236-242. doi: 10.1016/j.bpj.2020.06.006. Epub 2020 Jun 12. Biophys J. 2020. PMID: 32579966 Free PMC article. Review.
-
Gating modulation of the KCNQ1 channel by KCNE proteins studied by voltage-clamp fluorometry.Biophys Physicobiol. 2019 May 23;16:121-126. doi: 10.2142/biophysico.16.0_121. eCollection 2019. Biophys Physicobiol. 2019. PMID: 31236320 Free PMC article. Review.
References
-
- Albers, R.W. 1967. Biochemical aspects of active transport. Annu. Rev. Biochem. 36:727–756. - PubMed
-
- Axelsen, K.B., and M.G. Palmgren. 1998. Evolution of substrate specificities in the P-type ATPase superfamily. J. Mol. Evol. 46:84–101. - PubMed
-
- Beguin, P., U. Hasler, A. Beggah, J.D. Horisberger, and K. Geering. 1998. Membrane integration of Na,K-ATPase α subunits and β subunits assembly. J. Biol. Chem. 273:24921–24931. - PubMed
-
- Beguin, P., U. Hasler, O. Staub, and K. Geering. 2000. Endoplasmic reticulum quality control of oligomeric membrane proteins: topogenic determinants involved in the degradation of the unassembled Na,K-ATPase α subunit and in its stabilization by β subunit assembly. Mol. Biol. Cell. 11:1657–1672. - PMC - PubMed
