. 2005 Jun;6(6):571-8.
doi: 10.1038/ni1198. Epub 2005 Apr 24.

Negative regulation of Toll-like receptor 4 signaling by the Toll-like receptor homolog RP105

Affiliations

Negative regulation of Toll-like receptor 4 signaling by the Toll-like receptor homolog RP105

Senad Divanovic et al. Nat Immunol. 2005 Jun.

Abstract

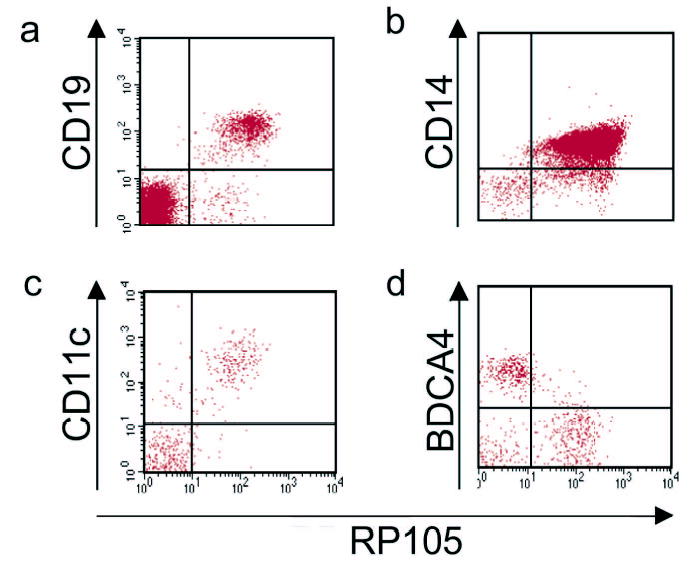
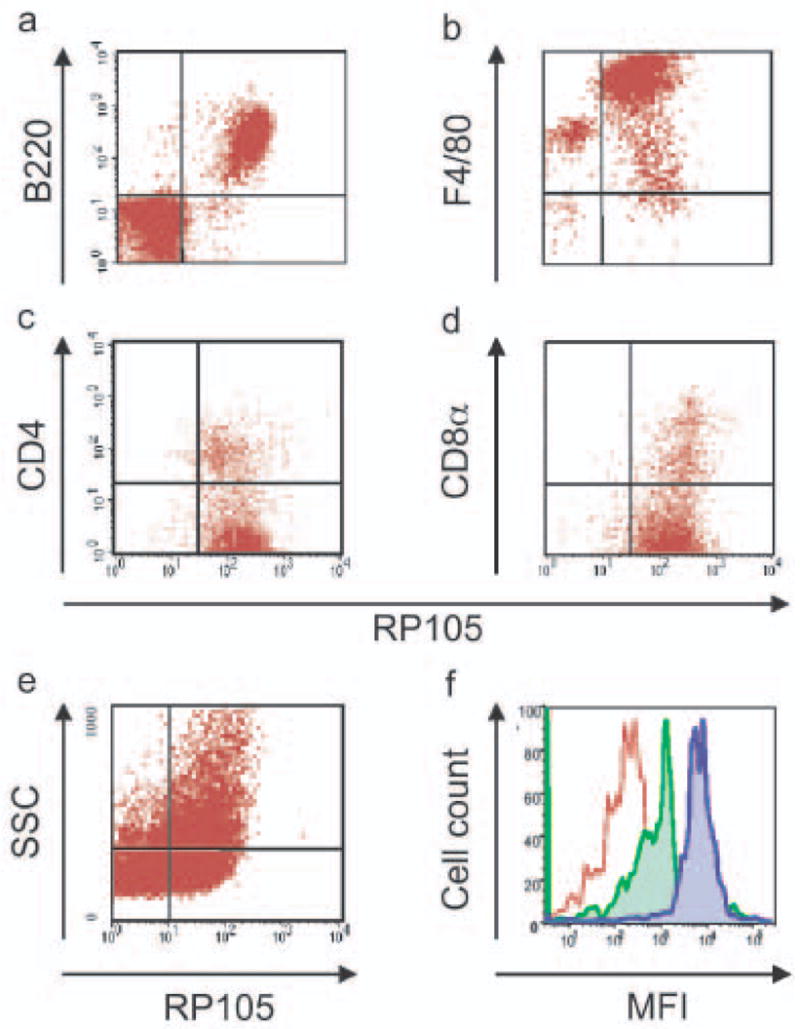
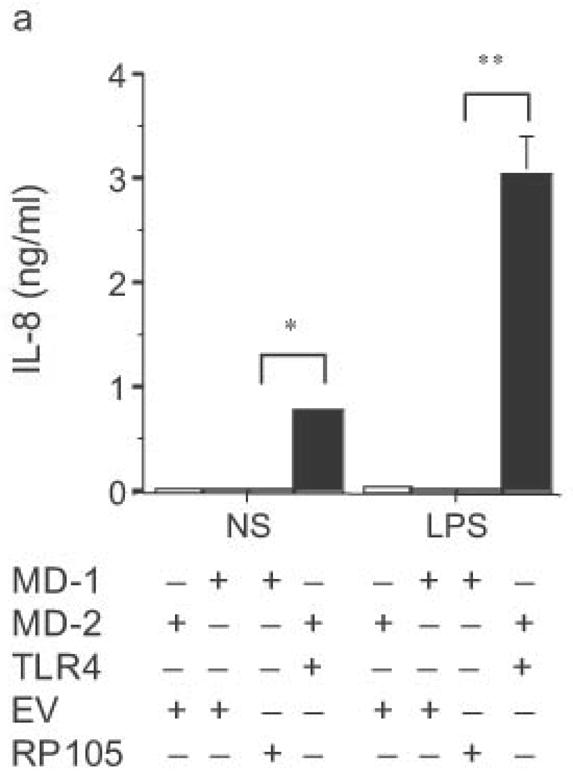
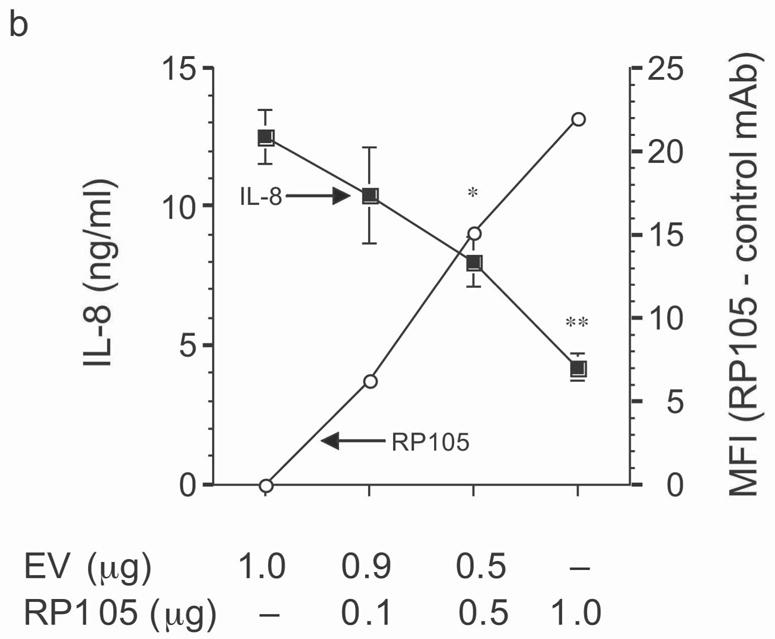
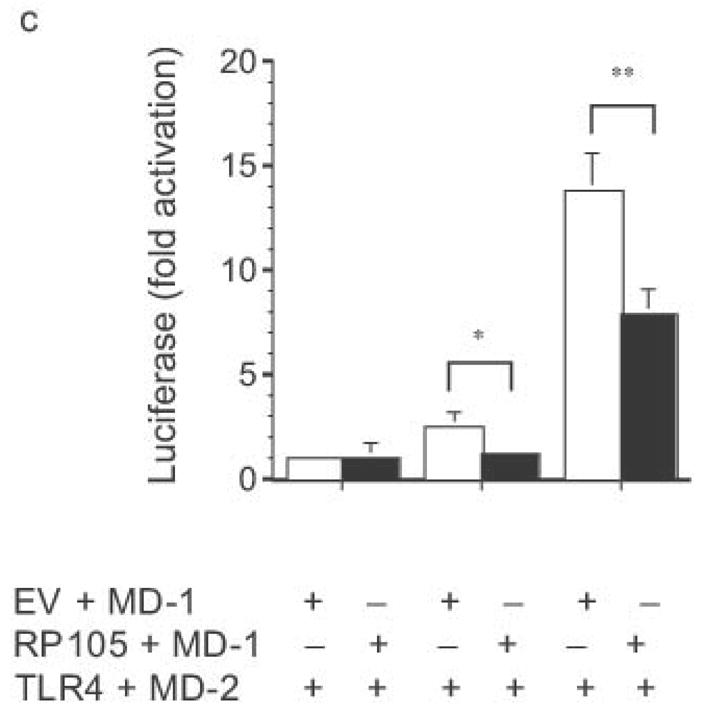
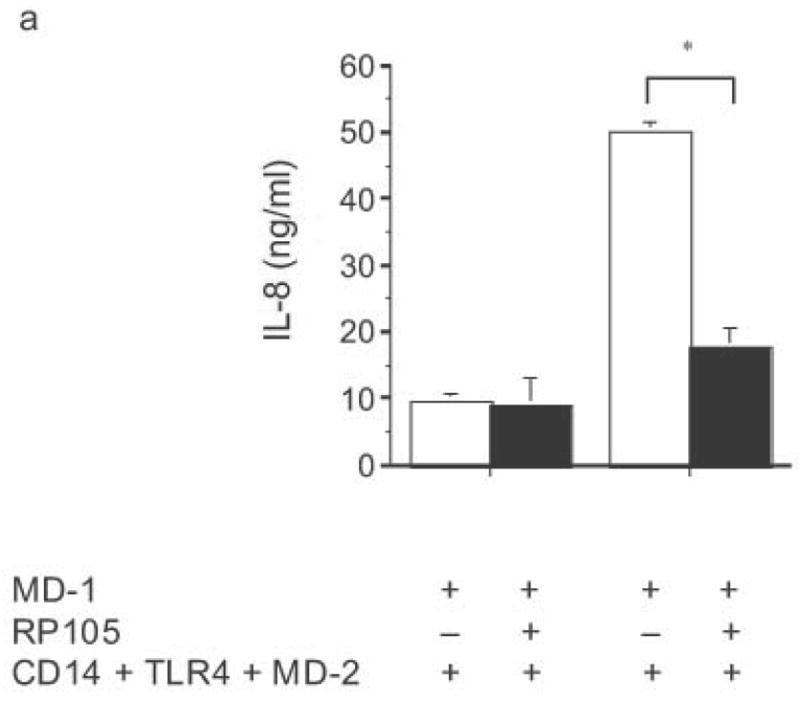
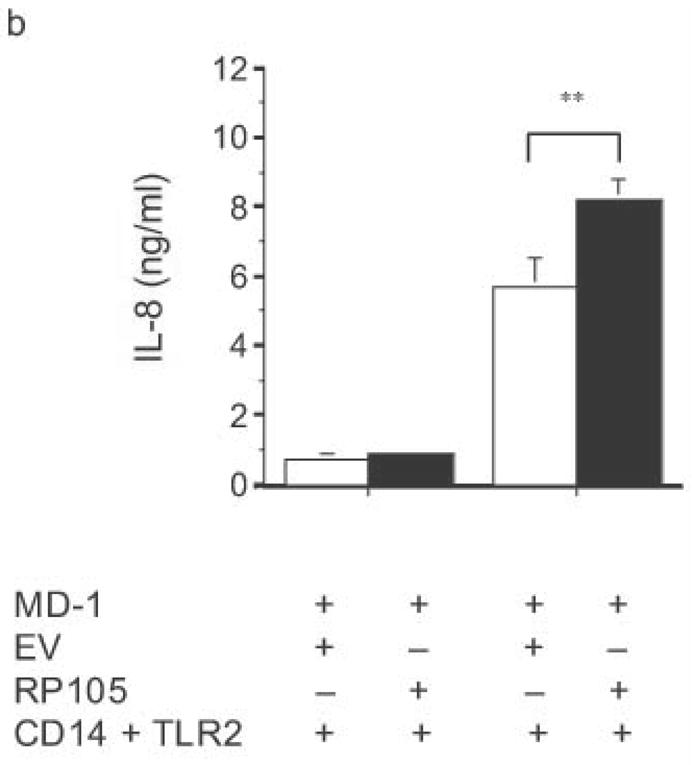
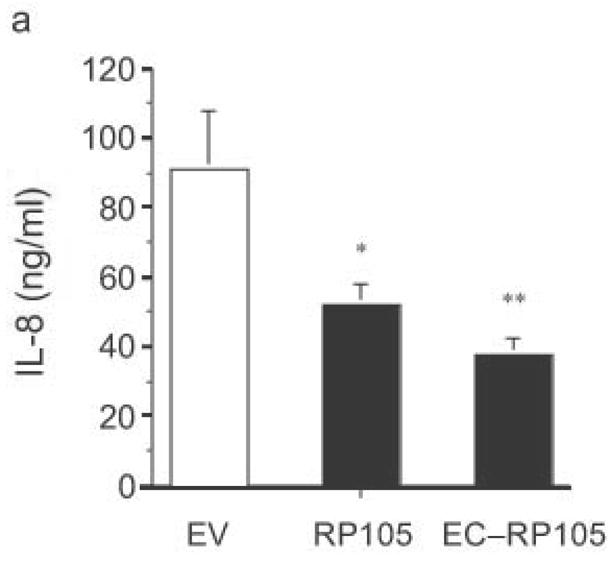
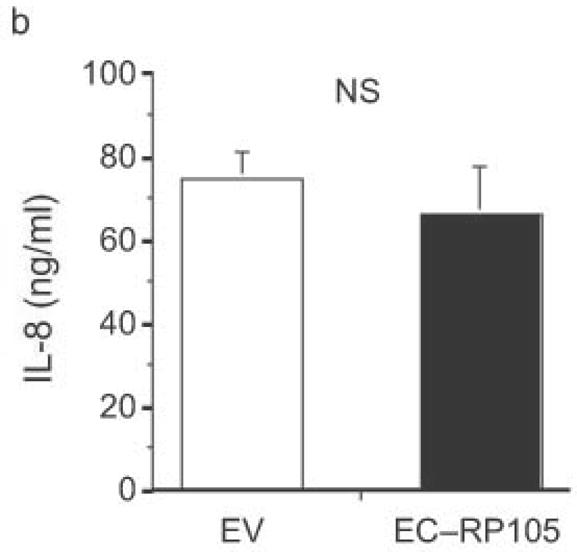
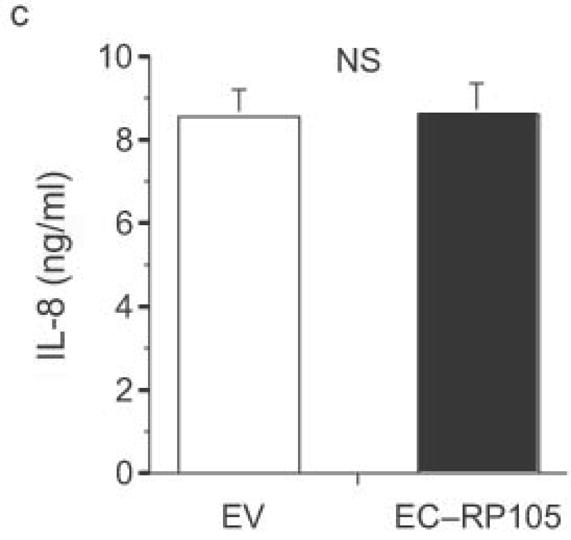
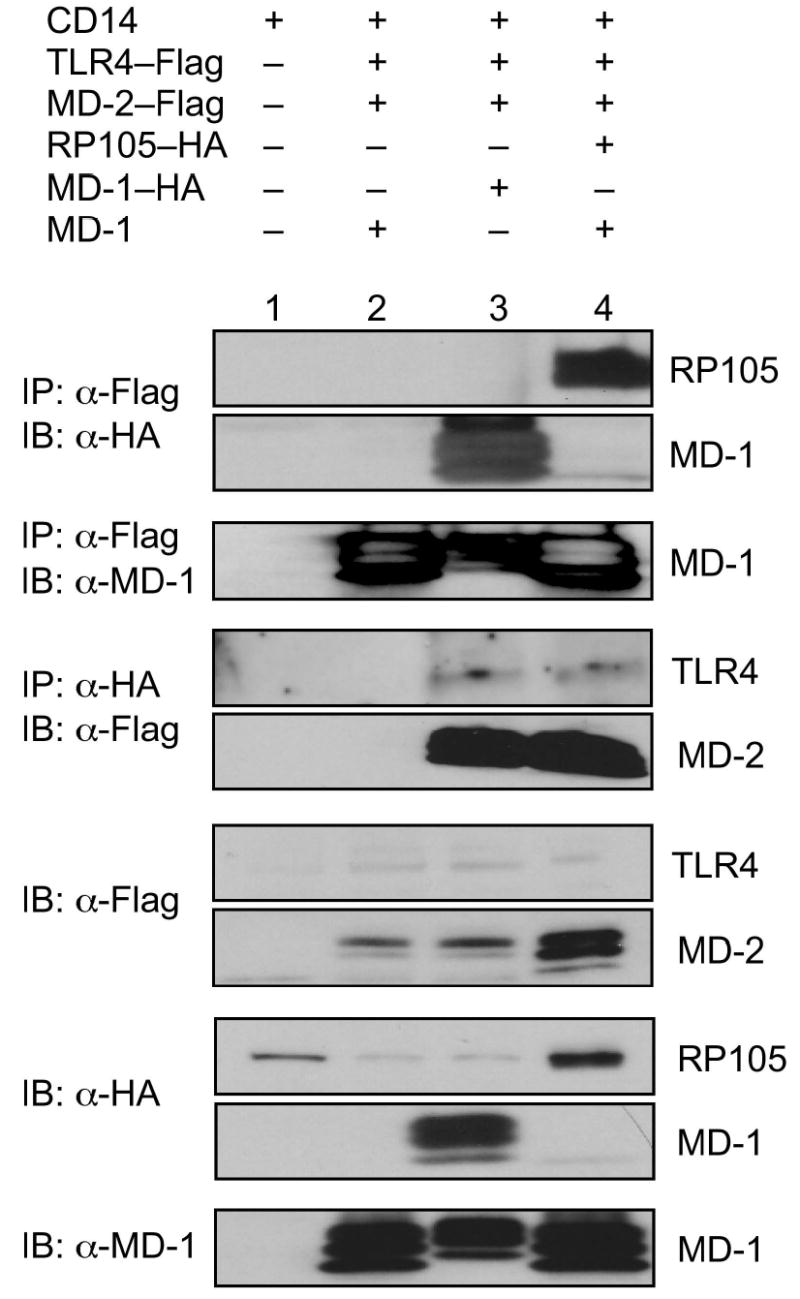
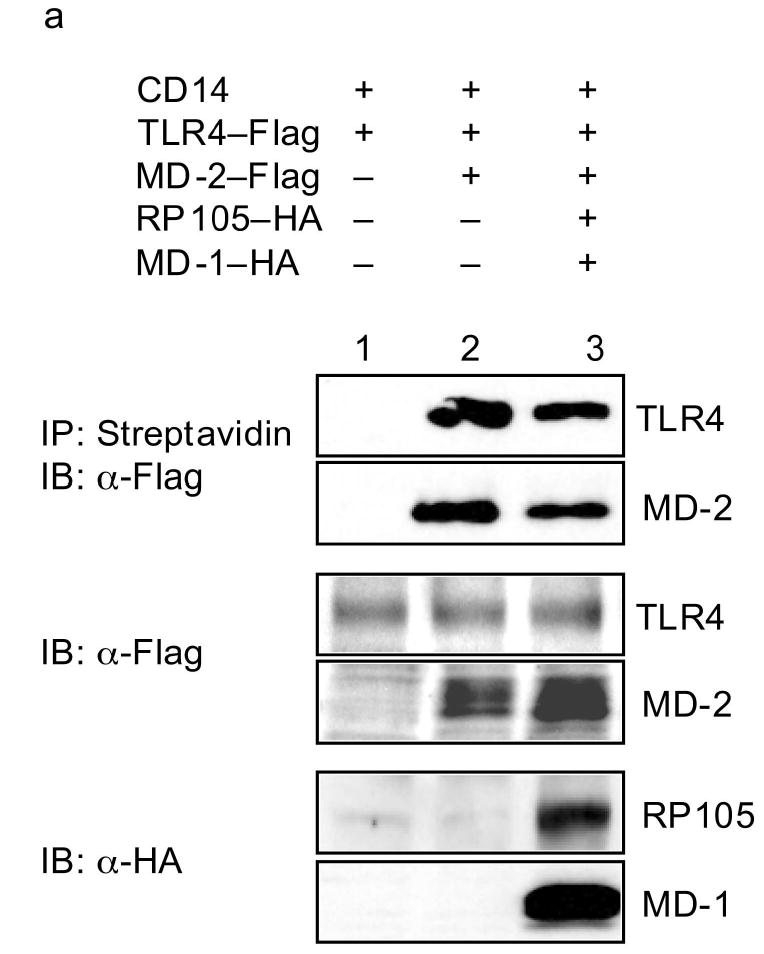
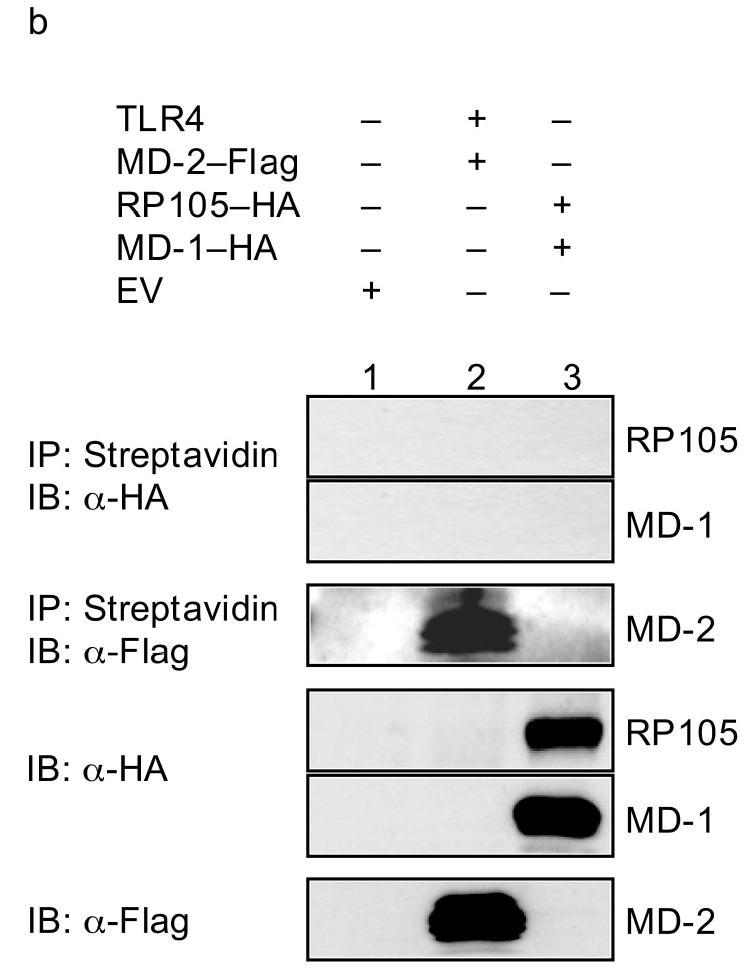
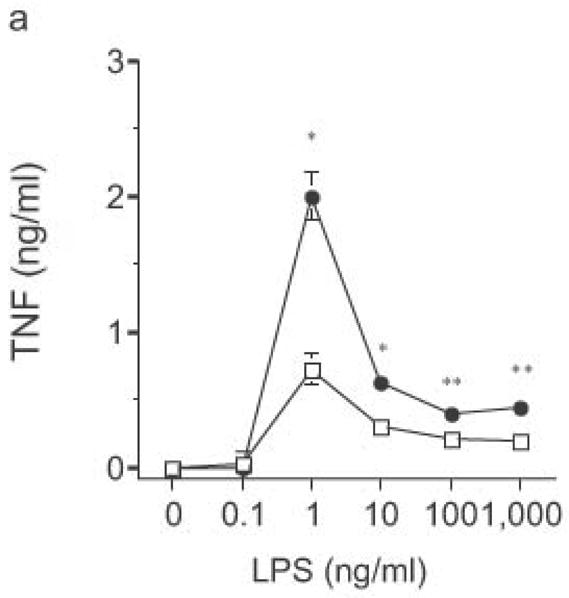
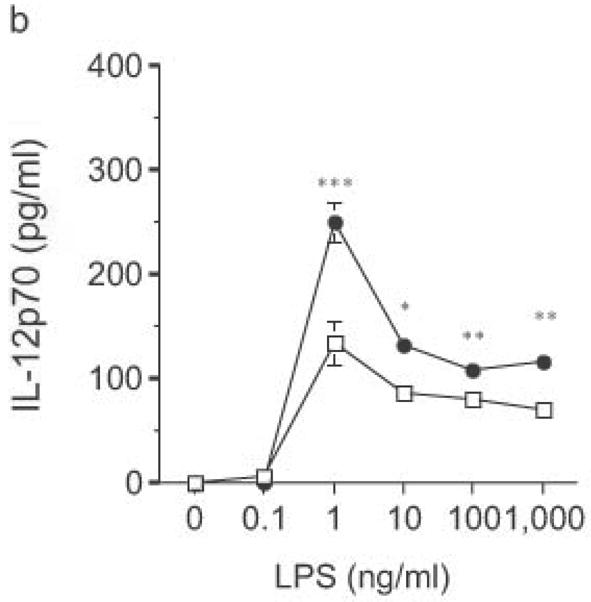
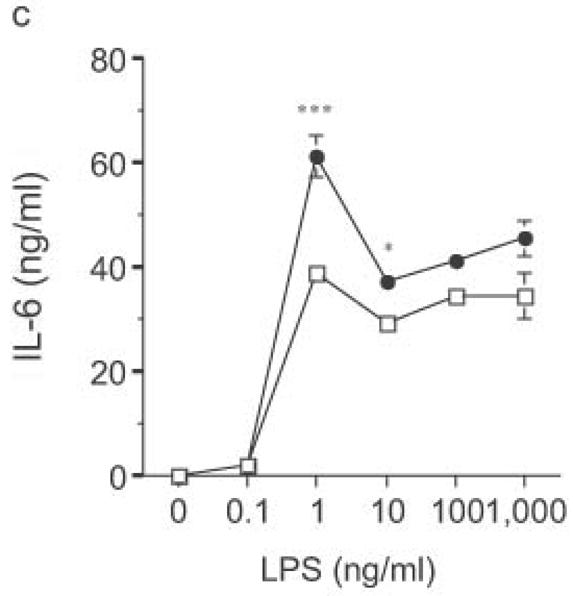
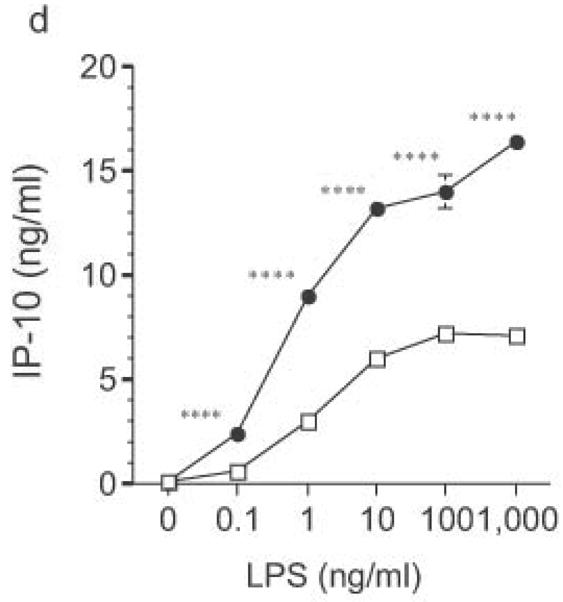
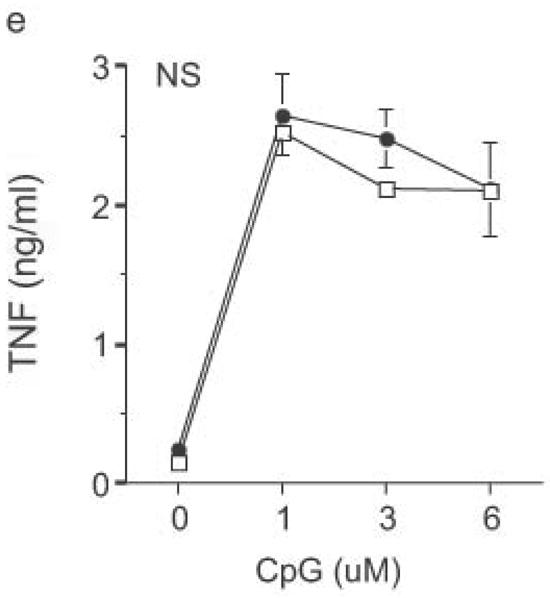
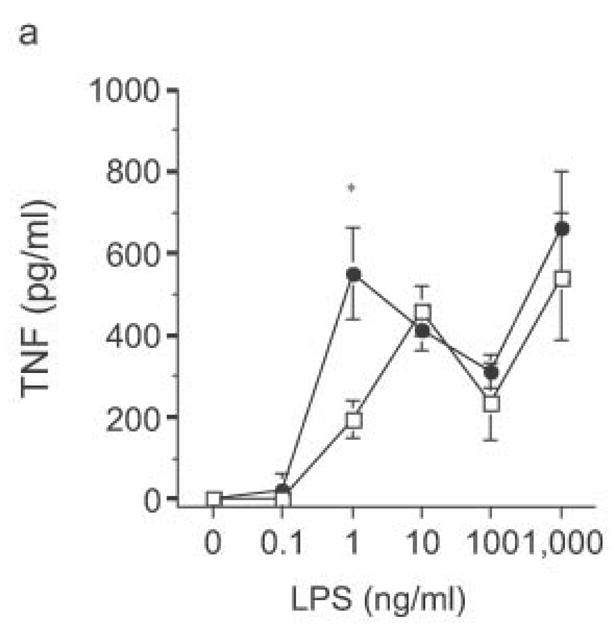
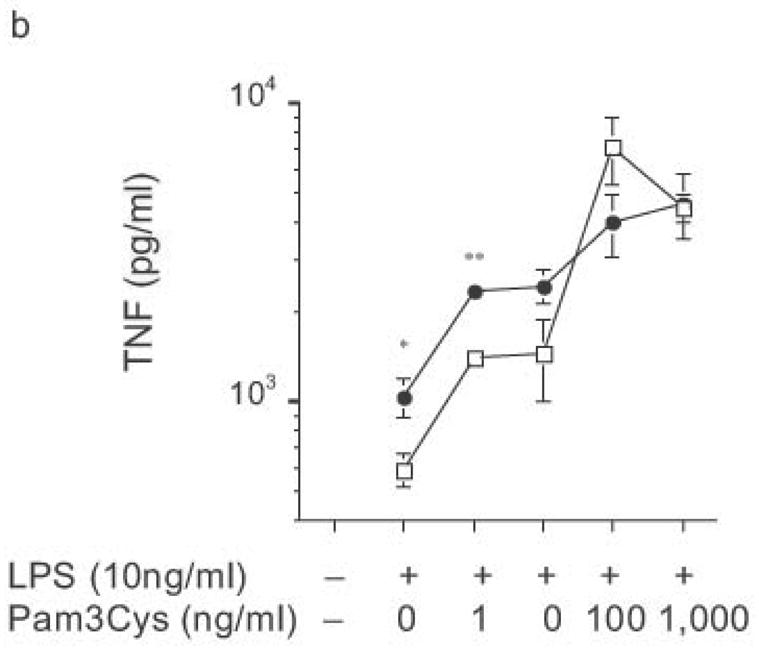
Activation of Toll-like receptor (TLR) signaling by microbial signatures is critical to the induction of immune responses. Such responses demand tight regulation. RP105 is a TLR homolog thought to be mostly B cell specific, lacking a signaling domain. We report here that RP105 expression was wide, directly mirroring that of TLR4 on antigen-presenting cells. Moreover, RP105 was a specific inhibitor of TLR4 signaling in HEK 293 cells, a function conferred by its extracellular domain. Notably, RP105 and its helper molecule, MD-1, interacted directly with the TLR4 signaling complex, inhibiting its ability to bind microbial ligand. Finally, RP105 regulated TLR4 signaling in dendritic cells as well as endotoxin responses in vivo. Thus, our results identify RP105 as a physiological negative regulator of TLR4 responses.


Figures

Figure 1
Figure 1
RP105 expression by human peripheral blood leukocytes. Flow cytometric analysis of PBMC from healthy human donors. (a) B cells; (b) monocytes; (c) myeloid DC; (d) plasmacytoid DC. Myeloid DC were identified as lineage negative (CD3,CD14,CD19,CD20,CD56), HLA-DR+, CD11c+. Plasmacytoid DC were identified as lineage negative, HLA-DR+, CD11c, BDCA-4+. Data are representative of an experimental n > 15 for monocytes; n = 3 for the other cell types.
Figure 2
Figure 2
RP105 expression by murine leukocytes. Flow cytometric analysis of cell populations. (a) splenic B cells (representative of an experimental n > 50). (b) resident peritoneal macrophages (n = 5). (c) splenic CD11c+CD11b+ CD4 and CD11c+CD11b+CD4+ DC (n = 6). (d) splenic CD11c+CD11bCD8α+DC (n = 6). (e) bone marrow-derived DC (n = 6). (f) splenic plasmacytoid DC (CD19+B220+CD11c+GR-1+) [n = 5]; red: isotype control, green: TLR4, blue: RP105. Analysis of splenic DC subsets was performed after 10 d of in vivo treatment with flt3L.
Figure 3
Figure 3
Dose-dependent suppression of TLR4 signaling in HEK293 cells by RP105 expression. (a) HEK293 cells stably expressing CD14 were transiently transfected with cDNA encoding MD-1, MD-2, TLR4, empty vector control cDNA (EV) and/or RP105. Cells were subsequently stimulated with purified E. coli K235 LPS (10 ng/ml). (b) HEK293 cells stably expressing CD14 and TLR4 were transiently transfected with MD-1 and MD-2 along with the indicated concentrations of RP105 and/or EV cDNA, and secondarily stimulated with LPS (10 ng/ml). (c) HEK293 cells stably expressing MD-2 and TLR4 were transiently co-transfected with an NF-κB-firefly luciferase reporter plasmid, a TK-renilla luciferase reporter plasmid and MD-1, along with EV (open bars) or RP105 (filled bars). Cells were stimulated with the indicated concentrations of LPS. * p < 0.03, **p < 0.004, compared with RP105-deficient cells. Means +/− SE of triplicate cultures in a single experiment are depicted, representative of an experimental n = 4 (a and b); n = 2 (c). NS: no stimulation.
Figure 3
Figure 3
Dose-dependent suppression of TLR4 signaling in HEK293 cells by RP105 expression. (a) HEK293 cells stably expressing CD14 were transiently transfected with cDNA encoding MD-1, MD-2, TLR4, empty vector control cDNA (EV) and/or RP105. Cells were subsequently stimulated with purified E. coli K235 LPS (10 ng/ml). (b) HEK293 cells stably expressing CD14 and TLR4 were transiently transfected with MD-1 and MD-2 along with the indicated concentrations of RP105 and/or EV cDNA, and secondarily stimulated with LPS (10 ng/ml). (c) HEK293 cells stably expressing MD-2 and TLR4 were transiently co-transfected with an NF-κB-firefly luciferase reporter plasmid, a TK-renilla luciferase reporter plasmid and MD-1, along with EV (open bars) or RP105 (filled bars). Cells were stimulated with the indicated concentrations of LPS. * p < 0.03, **p < 0.004, compared with RP105-deficient cells. Means +/− SE of triplicate cultures in a single experiment are depicted, representative of an experimental n = 4 (a and b); n = 2 (c). NS: no stimulation.
Figure 4
Figure 4
Specificity of RP105-mediated suppression. (a) HEK293 cells stably expressing CD14 and TLR4 (open bars) or CD14, TLR4 and RP105 (filled bars) were transiently transfected with MD-1 and MD-2, and subsequently stimulated with purified E. coli K235 LPS (10 ng/ml) or IL-1β (100 ng/ml). (b) HEK293 cells stably expressing CD14 and TLR2 were transiently transfected with MD-1 and EV (open bars) or MD-1 and RP105 (filled bars) and subsequently stimulated with Zymosan A (10 μg/ml) or IL- 1β (100 ng/ml). * p < 0.0001, ** p = 0.05, compared with RP105-deficient cells. Means +/− SE of triplicate cultures in a single experiment are depicted, representative of an experimental n = 2–4.
Figure 4
Figure 4
Specificity of RP105-mediated suppression. (a) HEK293 cells stably expressing CD14 and TLR4 (open bars) or CD14, TLR4 and RP105 (filled bars) were transiently transfected with MD-1 and MD-2, and subsequently stimulated with purified E. coli K235 LPS (10 ng/ml) or IL-1β (100 ng/ml). (b) HEK293 cells stably expressing CD14 and TLR2 were transiently transfected with MD-1 and EV (open bars) or MD-1 and RP105 (filled bars) and subsequently stimulated with Zymosan A (10 μg/ml) or IL- 1β (100 ng/ml). * p < 0.0001, ** p = 0.05, compared with RP105-deficient cells. Means +/− SE of triplicate cultures in a single experiment are depicted, representative of an experimental n = 2–4.
Figure 5
Figure 5
The extracellular domain of RP105 is sufficient to effect suppression of TLR4 signaling. (a) HEK293 cells stably expressing CD14 and TLR4 were transiently transfected with MD-2 and MD-1, along with EV, RP105 or the extracellular domain of RP105 (EC-RP105), as indicated. Cells were subsequently stimulated with purified E. coli K235 LPS (10 ng/ml). Means +/− SE of triplicate cultures in a single experiment are depicted, representative of an experimental n = 4 *p < 0.02, **p < 0.002, compared with RP105-deficient cells. (b, c) HEK293 cells stably expressing CD14 and TLR2 were transiently transfected with MD-2 and MD-1, along with EV or EC-RP105, as indicated. Cells were subsequently stimulated with (b) Zymosan A (10 μg/ml) or (c) IL-1β (100 ng/ml) as noted. Means +/− SE of replicate cultures (n =9) are depicted. NS, not significant.
Figure 5
Figure 5
The extracellular domain of RP105 is sufficient to effect suppression of TLR4 signaling. (a) HEK293 cells stably expressing CD14 and TLR4 were transiently transfected with MD-2 and MD-1, along with EV, RP105 or the extracellular domain of RP105 (EC-RP105), as indicated. Cells were subsequently stimulated with purified E. coli K235 LPS (10 ng/ml). Means +/− SE of triplicate cultures in a single experiment are depicted, representative of an experimental n = 4 *p < 0.02, **p < 0.002, compared with RP105-deficient cells. (b, c) HEK293 cells stably expressing CD14 and TLR2 were transiently transfected with MD-2 and MD-1, along with EV or EC-RP105, as indicated. Cells were subsequently stimulated with (b) Zymosan A (10 μg/ml) or (c) IL-1β (100 ng/ml) as noted. Means +/− SE of replicate cultures (n =9) are depicted. NS, not significant.
Figure 6
Figure 6
RP105–MD-1 interacts directly with TLR4–MD-2. HEK293 cells stably expressing CD14 (lane 1) or CD14 and FLAG-tagged TLR4 (lanes 2–4) were transiently transfected with MD-2, RP105 and/or MD-1 constructs, as indicated. Lysates were immunoprecipitated with antibodies to FLAG or HA, and the association between RP105–MD-1 and TLR4–MD-2 was examined by immunoblotting using antibodies to FLAG, HA and MD-1, as indicated. The expression of RP105, MD-1, TLR4, and MD-2 in cell lysates was characterized by immunoblotting using anti-FLAG, anti-HA and anti-MD-1 antibodies, as indicated. Data are from a single experiment, representative of an n = 3.
Figure 7
Figure 7
RP105–MD-1 inhibits LPS binding to TLR4–MD-2. HEK293 cells stably expressing CD14 and FLAG-tagged TLR4 (a), or HEK293FT cells (b), were transiently transfected with empty vector (EV), MD-2, RP105, MD-1 and/or TLR4 constructs, as indicated. After incubation with biotinylated LPS, cells were lysed, lysates were immunoprecipitated with streptavidin-conjugated Sepharose A beads, and the association of LPS with (a) TLR4–MD-2 or (b) RP105–MD-1 was examined by immunoblotting using anti-FLAG or anti-HA antibodies, respectively. The expression of RP105, MD-1, TLR4, and MD-2 in cell lysates was characterized by immunoblotting using anti-FLAG and anti-HA antibodies as indicated. Data are from a single experiment, representative of an n = 2 (a), or 1 (b).
Figure 7
Figure 7
RP105–MD-1 inhibits LPS binding to TLR4–MD-2. HEK293 cells stably expressing CD14 and FLAG-tagged TLR4 (a), or HEK293FT cells (b), were transiently transfected with empty vector (EV), MD-2, RP105, MD-1 and/or TLR4 constructs, as indicated. After incubation with biotinylated LPS, cells were lysed, lysates were immunoprecipitated with streptavidin-conjugated Sepharose A beads, and the association of LPS with (a) TLR4–MD-2 or (b) RP105–MD-1 was examined by immunoblotting using anti-FLAG or anti-HA antibodies, respectively. The expression of RP105, MD-1, TLR4, and MD-2 in cell lysates was characterized by immunoblotting using anti-FLAG and anti-HA antibodies as indicated. Data are from a single experiment, representative of an n = 2 (a), or 1 (b).
Figure 8
Figure 8
Altered TLR4-induced cytokine production by dendritic cells from RP105-deficient mice. Bone marrow-derived DC from wild-type (open symbols) or RP105-deficient (filled symbols) mice were stimulated with purified E. coli K235 LPS (a–d) or CpG DNA (e). Supernatants were harvested after 24 h. (a) TNF. (b) IL-12p70. (c) IL-6. (d) IP-10. (e) TNF. * p < 0.05, ** p < 0.001, *** p < 0.01, **** p < 0.0001. Means + SE of triplicate cultures in a single experiment, representative of an n = 8 (a); 4 (b, c); 7 (d); or 3 (e).
Figure 8
Figure 8
Altered TLR4-induced cytokine production by dendritic cells from RP105-deficient mice. Bone marrow-derived DC from wild-type (open symbols) or RP105-deficient (filled symbols) mice were stimulated with purified E. coli K235 LPS (a–d) or CpG DNA (e). Supernatants were harvested after 24 h. (a) TNF. (b) IL-12p70. (c) IL-6. (d) IP-10. (e) TNF. * p < 0.05, ** p < 0.001, *** p < 0.01, **** p < 0.0001. Means + SE of triplicate cultures in a single experiment, representative of an n = 8 (a); 4 (b, c); 7 (d); or 3 (e).
Figure 9
Figure 9
Ability of heterologous TLR signaling to overcome RP105-mediated inhibition of TLR4 signaling. Bone marrow-derived DC from wild-type (open symbols) or RP105-deficient (filled symbols) mice were stimulated with: (a) commercial E. coli K235 LPS; or (b) purified E. coli K235 LPS plus the TLR2 agonist, Pam 3Cys. * p < 0.05, ** p < 0.001. Means + SE of triplicate cultures in a single experiment; representative of an experimental n = 4.
Figure 9
Figure 9
Ability of heterologous TLR signaling to overcome RP105-mediated inhibition of TLR4 signaling. Bone marrow-derived DC from wild-type (open symbols) or RP105-deficient (filled symbols) mice were stimulated with: (a) commercial E. coli K235 LPS; or (b) purified E. coli K235 LPS plus the TLR2 agonist, Pam 3Cys. * p < 0.05, ** p < 0.001. Means + SE of triplicate cultures in a single experiment; representative of an experimental n = 4.
Figure 10
Figure 10
Exaggerated in vivo responses to LPS in RP105−/− mice. (a) Wild-type mice (n = 17) (open bars) or RP105-deficient mice (n = 18) (filled bars) were challenged intraperitoneally with 25 μg of purified E. coli K235 LPS. Serum was harvested 60 min later. (b) Wild type (open symbols) or RP105−/− mice (filled symbols) were challenged with 8 mg/kg of purified E. coli K235 LPS (n = 7/group). Data represent means + SE. *p < 0.0005, ** p < 0.00005, *** p < 10−8, **** p < 0.01.
Figure 10
Figure 10
Exaggerated in vivo responses to LPS in RP105−/− mice. (a) Wild-type mice (n = 17) (open bars) or RP105-deficient mice (n = 18) (filled bars) were challenged intraperitoneally with 25 μg of purified E. coli K235 LPS. Serum was harvested 60 min later. (b) Wild type (open symbols) or RP105−/− mice (filled symbols) were challenged with 8 mg/kg of purified E. coli K235 LPS (n = 7/group). Data represent means + SE. *p < 0.0005, ** p < 0.00005, *** p < 10−8, **** p < 0.01.

Similar articles

Cited by

References

    1. Medzhitov R, Janeway C., Jr Innate immune recognition: mechanisms and pathways. Immunol Rev. 2000;173:89–97. - PubMed
    1. Takeda K, Kaisho T, Akira S. Toll-like receptors. Annu Rev Immunol. 2003;21:335–76. - PubMed
    1. Beutler B, Rietschel ET. Innate immune sensing and its roots: the story of endotoxin. Nat Rev Immunol. 2003;3:169–76. - PubMed
    1. Ardizzone S, Porro GB. Inflammatory bowel disease: new insights into pathogenesis and treatment. J Intern Med. 2002;252:475–96. - PubMed
    1. Bingham CO., 3rd The pathogenesis of rheumatoid arthritis: pivotal cytokines involved in bone degradation inflammation. J Rheumatol Suppl. 2002;65:3–9. - PubMed

Publication types

MeSH terms