Clinical Trial
. 2005 May;57(5):704-12.
doi: 10.1002/ana.20473.

Natural history of denervation in SMA: relation to age, SMN2 copy number, and function

Affiliations
Clinical Trial

Natural history of denervation in SMA: relation to age, SMN2 copy number, and function

Kathryn J Swoboda et al. Ann Neurol. 2005 May.

Abstract

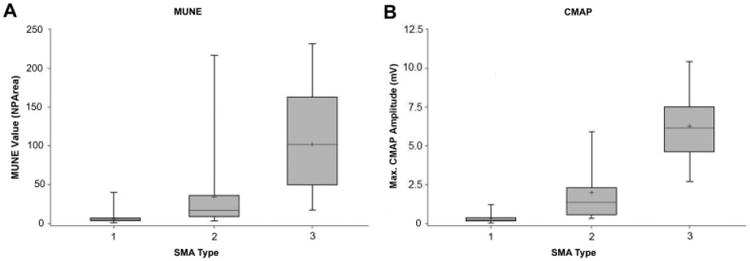
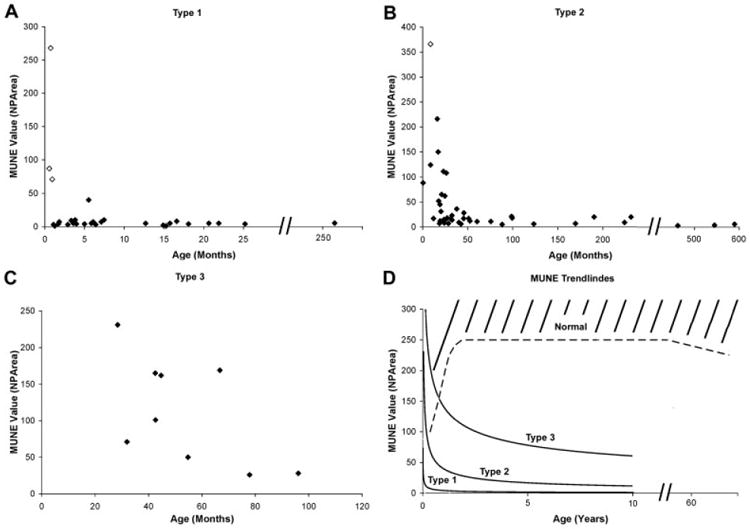
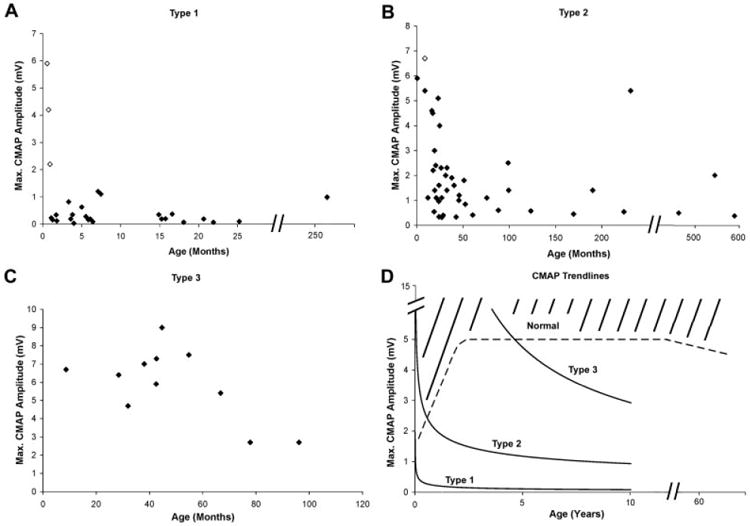
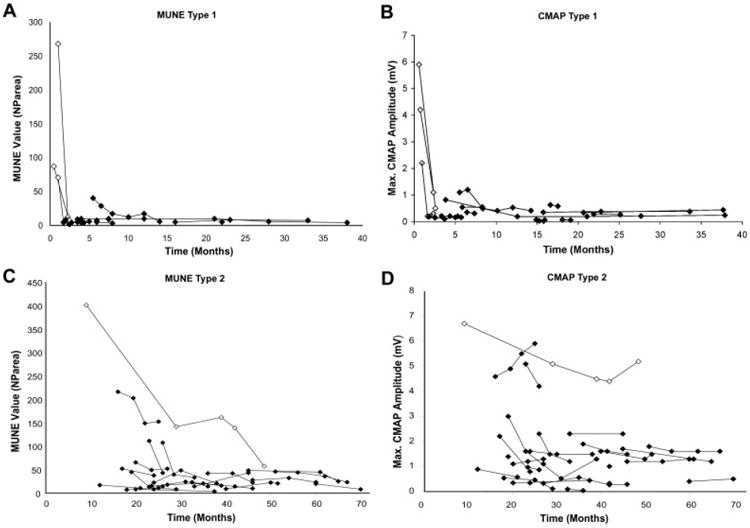
Denervation was assessed in 89 spinal muscular atrophy (SMA) 1, 2, and 3 subjects via motor unit number estimation (MUNE) and maximum compound motor action potential amplitude (CMAP) studies, and results correlated with SMN2 copy, age, and function. MUNE and maximum CMAP values were distinct among SMA subtypes (p < 0.05). Changes in MUNE and maximum CMAP values over time were dependent on age, SMA type, and SMN2 copy number. SMN2 copy number less than 3 correlated with lower MUNE and maximum CMAP values (p < 0.0001) and worse functional outcomes. As SMN2 copy number increases, so does functional status (p < 0.0001). Change in MUNE longitudinally over the time intervals examined in this study was not statistically significant for any SMA cohort. However, a decline in maximum CMAP over time was apparent in SMA2 subjects (p = 0.049). Age-dependent decline in MUNE and maximum CMAP was apparent in both SMA 1 (p < 0.0001) and SMA 2 (p < 0.0001) subjects, with age as an independent factor regardless of type. Maximum CMAP at the time of the initial assessment was most predictive of functional outcome (p < 0.0001). Prospective longitudinal studies in four prenatally diagnosed infants demonstrated significant progressive denervation in association with symptomatic onset or functional decline. These data highlight the potential value of such measures in increasing our understanding of pathophysiological factors involved in denervation in SMA.


Figures

Fig 1
Fig 1
(A, B) MUNE and CMAP data, respectively, by SMA type in boxplot format. The shaded gray boxes represent the interquartile range (75th%–25th%) of the data. The whiskers demonstrate a measure of data variability, and the horizontal black lines within the gray boxes indicate median values, and plus signs indicated mean values, in each category. SMA = spinal muscular atrophy; MUNE = motor unit number estimation; CMAP = compound motor action potential amplitude.
Fig 2
Fig 2
(A–C) Cross-sectional MUNE data obtained at first visit for spinal muscular atrophy type 1, 2, 3 subjects, respectively. Open diamonds indicate subjects identified prenatally via genetic testing because of a previously affected sibling. Solid diamonds indicate subjects with confirmation via genetic testing following symptom onset. (D) Power trendlines representing data for all three types. Estimated minimum normative values indicated by dashed line. MUNE = motor unit number estimation; NPArea = negative peak area.
Fig 3
Fig 3
(A–C) Cross-sectional maximum CMAP data obtained at first visit for spinal muscular atrophy type 1, 2, and 3 subjects, respectively. Open diamonds indicate subjects identified presymptomatically via genetic testing because of a previously affected sibling. Solid diamonds indicate subjects with confirmation via genetic testing after symptom onset. (D) Power trendlines representing data for all three types. Estimated minimum normative values indicated by dashed line. CMAP = compound motor action potential amplitude.
Fig 4
Fig 4
(A–C) Longitudinal MUNE and CMAP data, respectively, in type 1 subjects with more than one assessment. (B, D) Longitudinal MUNE and CMAP data, respectively, in type 2 subjects with more than one assessment. CMAP = compound motor action potential amplitude; MUNE = motor unit number estimation; NParea = negative peak area.

References

    1. Roberts DF, Chavez J, Court SD. The genetic component in child mortality. Arch Dis Child. 1970;45:33–38. - PMC - PubMed
    1. Pearn JH. The gene frequency of acute Werdnig-Hoffmann disease (SMA type 1). A total population survey in North-East England. J Med Genet. 1973;10:260–265. - PMC - PubMed
    1. Pearn J. Incidence, prevalence, and gene frequency studies of chronic childhood spinal muscular atrophy. J Med Genet. 1978;15:409–413. - PMC - PubMed
    1. Czeizel A, Hamula J. A hungarian study on Werdnig Hoffmann disease. J Med Genet. 1989;26:761–763. - PMC - PubMed
    1. Emery AE. Population frequencies of inherited neuromuscular diseases—a world survey. Neuromuscul Disord. 1991;1:19–29. - PubMed

Publication types

MeSH terms

Substances